Logistics and Technology: A Practical Guide for 2026
Logistics and technology explained: the core systems, measured results, KPIs to track and a 90-day plan to pilot them in 2026.
November 3, 2026

A container doesn't lose most of its time while it's moving. It loses time while it's waiting for someone, or some system, to tell the next team what to do. That's the central problem logistics and technology have to solve together, and it's why integration, not any single tool, decides whether an investment pays back.
Table of Contents
- What Logistics Technology Covers and Why It Matters
- Which Technology Solves Which Logistics Problem
- How Transport, Warehouse and Enterprise Systems Connect
- Real Implementations and the Results They Measured
- KPIs That Show Whether Technology Is Working
- Where Pilots Stall and Which Decisions Stay Human
- Assessing Logistics Technology Vendors Before You Buy
- Build a 90-Day Logistics Technology Pilot Plan
What Logistics Technology Covers and Why It Matters
A container typically spends 44 days moving from entry into the exporting country's port until departure from the destination port. That interval is approximately 60% of the total time required to trade goods internationally, according to the World Bank's 2023 Logistics Performance Index. A vessel can run to schedule while its container waits for customs paperwork, a carrier status update, or an inland booking.
Logistics technology moves information alongside freight. Its components fall into three layers, each with a different operational role:
- Physical equipment: Robots, vehicles, scanners, and sensors handle goods and record events.
- Execution software: A transportation management system (TMS), warehouse management system (WMS), and enterprise resource planning (ERP) system plan work, assign tasks, and record financial outcomes.
- Analytics and AI: Forecasting, optimization, and machine learning recommend or trigger decisions, such as which carrier to tender a shipment to or which order to pick first.
The layers matter most where their records and decisions meet. A sensor can report a shipment's location, but that update has limited value if the transport plan, warehouse schedule, and enterprise records do not reflect it. Electronic documents, shared shipment visibility, and predictive coordination across ports, customs agencies, carriers, and consignees can reduce delays by improving coordination across the supply chain.
For a practical view of how transport decisions are structured, read Peak Transport's transportation planning guide.
Test your operation: Identify the slowest handoff between two organizations in your network. If no system shows its current status, that handoff is a candidate for better information flow.
Which Technology Solves Which Logistics Problem
Every technology answers a different question. Where is it? What should move next? What will happen? What if the network changed? If you can't state which question you're buying an answer to, you'll buy overlapping tools and still miss the problem.
| Technology | Core job | Where it sits | Typical example |
|---|---|---|---|
| IoT sensors and telematics | Track location and condition of assets in transit | Vehicles, containers, pallets | Temperature alerts on refrigerated loads |
| Transportation management system (TMS) | Plan routes, choose carriers and audit freight | Transport planning | Carrier selection by lane and cost |
| Warehouse management system (WMS) | Control stock locations, receiving and picking | Warehouse floor | Wave picking and bin-level inventory accuracy |
| Robotics and automated handling | Move, sort and pick goods with less manual travel | Warehouse and sortation | Robots dispatched to reduce idle travel |
| AI and machine learning | Forecast demand, predict delays and flag exceptions | Planning and control towers | Early warning of late shipments |
| Digital twin | Simulate network changes before committing stock or capacity | Network and inventory planning | Testing a new replenishment rule |
| Edge computing | Decide locally when latency or connectivity matters | Docks, vehicles, robots | Stopping a conveyor without waiting for the cloud |
| Cloud data platform | Share one version of shipment and stock data across partners | Enterprise and partner systems | Shared status view for carriers and suppliers |
Matching the Row to the Pain
Telematics earns its keep when condition matters as much as location. A temperature excursion alert on a refrigerated load lets a dispatcher intervene while the product is still salvageable, not at the receiving dock. A TMS earns its keep on lane economics, comparing carriers on cost and service for each lane instead of defaulting to whoever handled the last load.
A WMS is the accuracy layer. If bin-level stock records are wrong, pickers hunt for product that isn't there and every downstream promise date becomes fiction. Robotics then raises throughput by cutting manual travel, but only when dispatching is coordinated. Uncoordinated robots create congestion faster than people do.
Prediction, Simulation, and Speed at the Edge
AI and machine learning sit one step ahead, forecasting demand and flagging exceptions before they become late deliveries. Planners who want to go deeper on testing demand assumptions will find scenario planning for inventory risk helpful, and our overview of AI applications across supply chain management shows how these forecasting use cases fit the wider stack. A digital twin answers a different question again, letting you test a replenishment rule or a new node in simulation before you commit inventory or sign a lease.
Edge computing covers the moments when a dock door, vehicle, or conveyor can't wait for a cloud round trip. The decision happens locally, in milliseconds, and syncs later. A cloud data platform does the opposite job, giving carriers, suppliers, and your own teams one shared version of shipment and stock data so nobody plans from a stale spreadsheet.
Rank your top three problems by cost, then pick the row that owns each one. One technology rarely solves a problem alone, so budget for the pairing, not just the headline tool.
How Transport, Warehouse and Enterprise Systems Connect
Treat the TMS, WMS, and ERP as organs and data events as the nerves between them. Each organ can be healthy on its own. A shipment still stalls when a signal fails to travel from one to the next. The diagram below maps that chain.
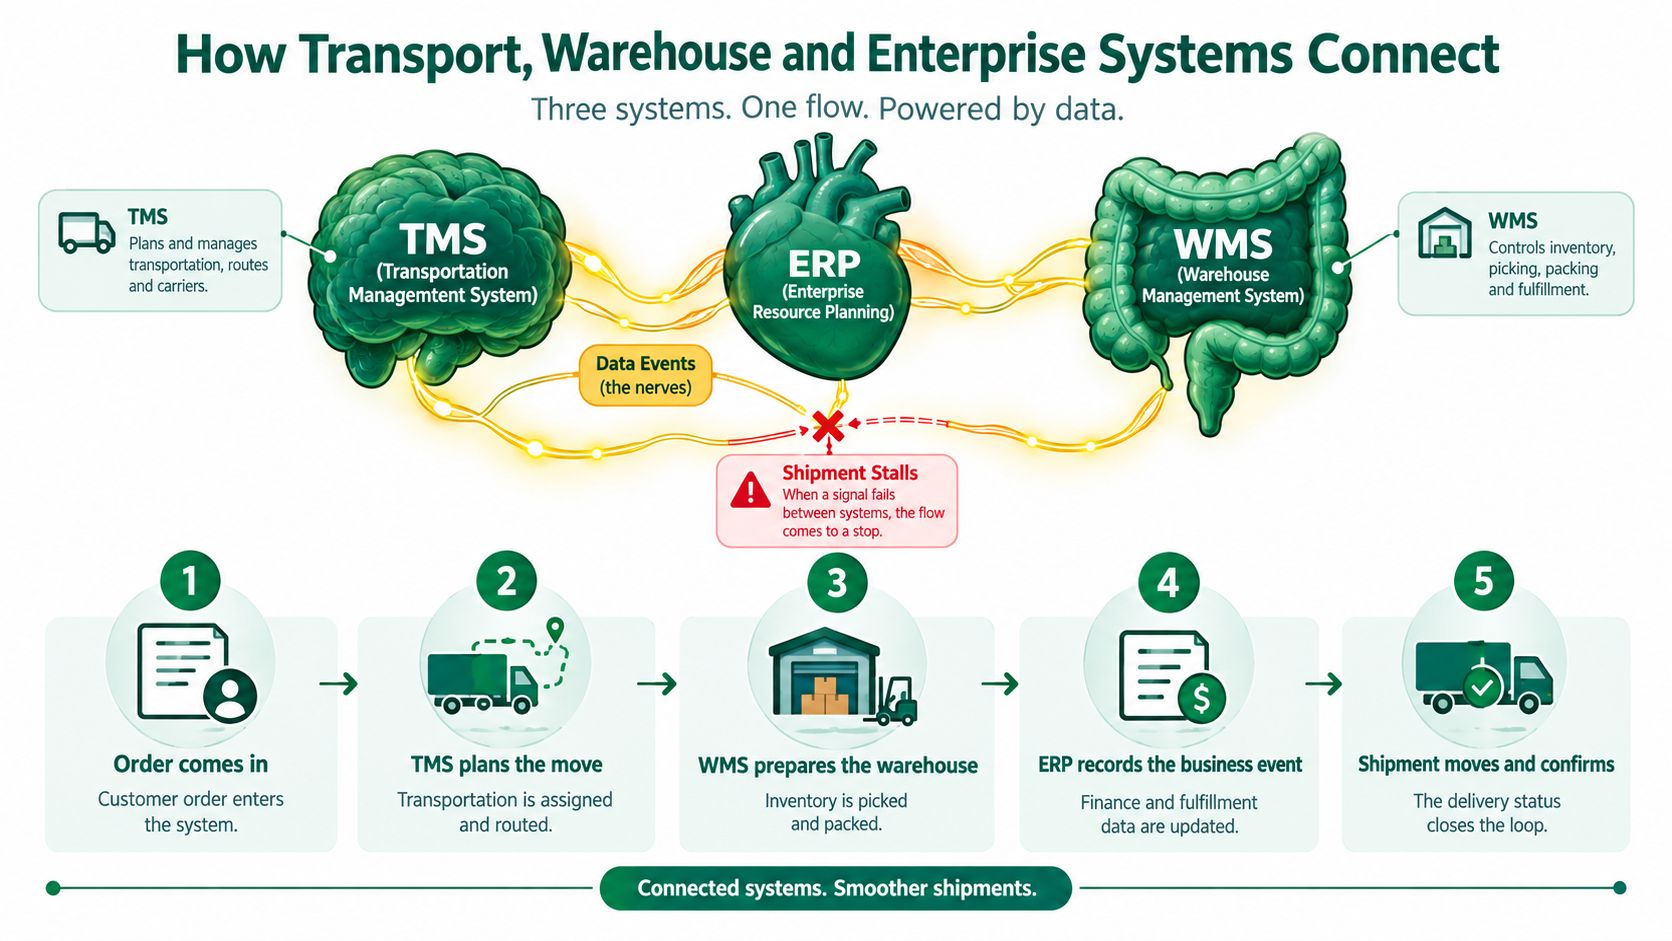
Five Handoffs and Where Each One Breaks
The core chain runs in a fixed order. An order is released in the ERP, stock is allocated and picked in the WMS, the shipment is tendered to a carrier in the TMS, carrier tracking events flow back into the TMS, and invoices plus proof of delivery post back to the ERP to close the loop.
Each handoff has a characteristic failure. Mismatched item IDs between ERP and WMS mean the warehouse allocates the wrong product or none at all. Unit-of-measure differences, cases in one system and eaches in another, corrupt quantities without triggering an alert. Late carrier status updates leave customer service answering calls with yesterday's location, and duplicate orders appear when a retry at one interface creates a second release downstream. None of these are model problems. They're definition problems, and they need one named owner for each event definition, such as what counts as shipped, delivered, or available.
Integrate Upstream Before You Polish the Storefront
A 2025 empirical study of 150 listed manufacturing firms in China reported a statistically significant positive relationship between supplier digitalization and environmental performance, with a standardized coefficient of β = 0.501 and p < 0.01**, while customer digitalization alone was not statistically significant, at **β = 0.068 and p > 0.10. Read that practically. Connecting supplier-facing processes, where purchase orders, advance ship notices, and production status originate, appears to pay off more than adding another customer-facing portal on top of shaky upstream data.
Consolidation follows the same logic inside one company. The case of how DHL consolidated 7 disconnected safety systems into one platform with Samsara shows what operators gain when fragmented event streams land in a single place.
Draw the five handoffs for your largest lane on one page. Mark every point where a person re-keys data by hand. Those marks are your integration backlog, in priority order.
Real Implementations and the Results They Measured
The chart below frames the strongest controlled result in this set, a robot-assisted warehouse experiment measured against a benchmark method.
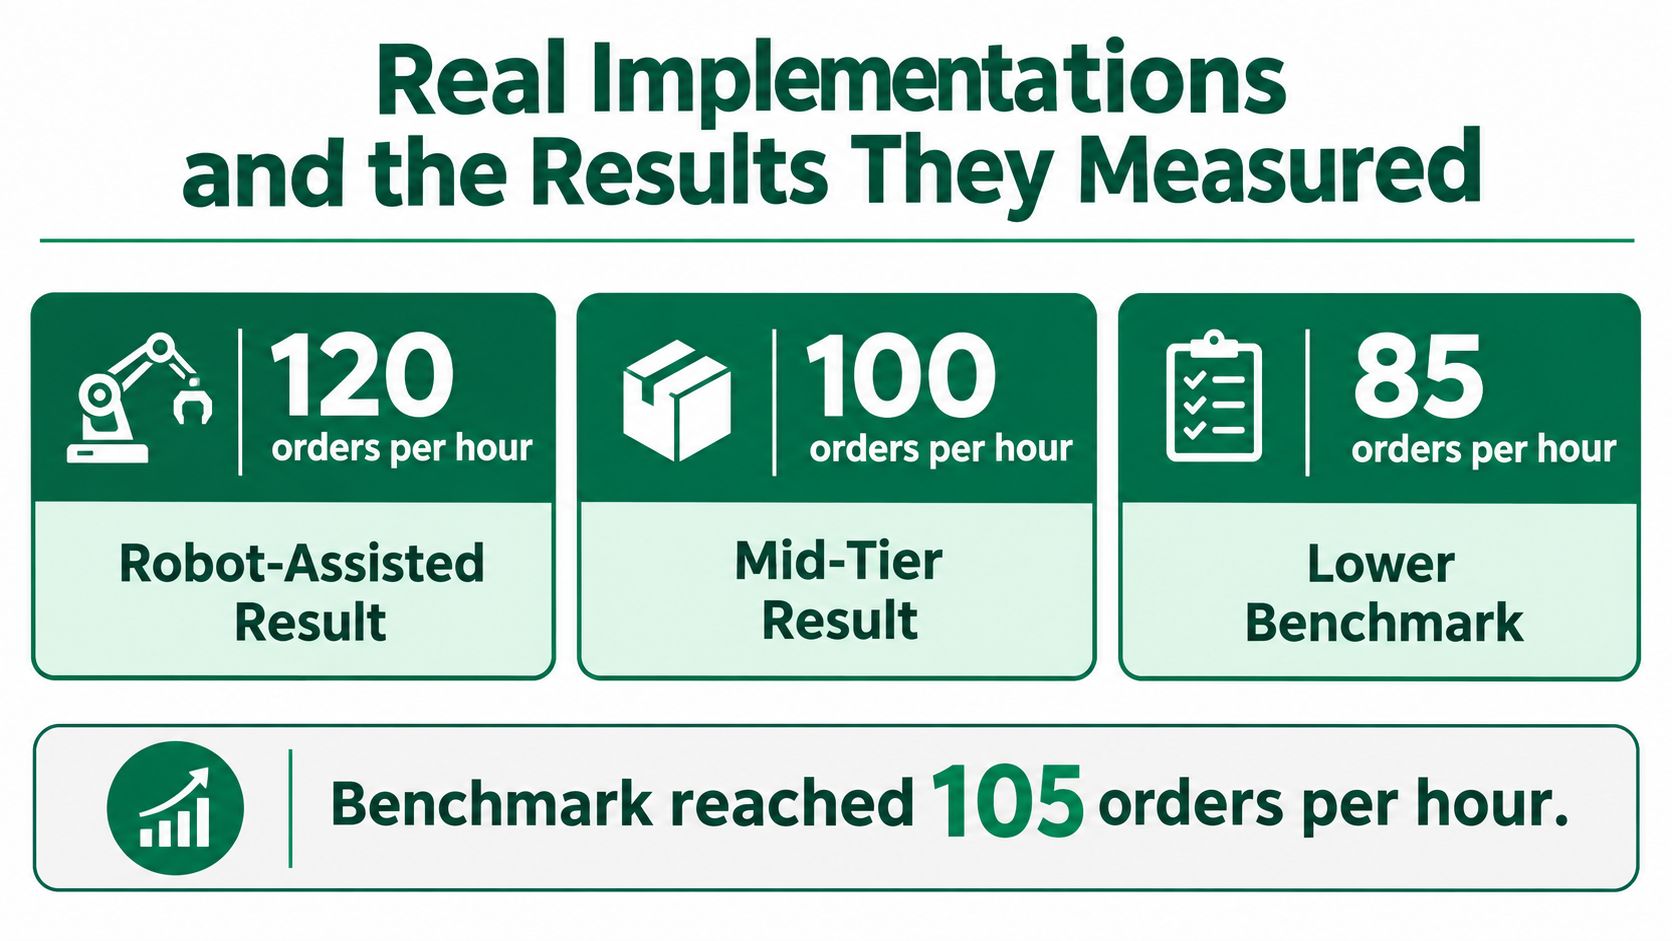
In that experimental evaluation of a robot-assisted warehouse-management system, the full system achieved approximately 120 orders per hour, compared with 105 orders per hour for the benchmark method. By order size, throughput was 120, 100, and 85 orders per hour for small, medium, and large orders, versus 105, 89, and 72 for the next-best comparison, with robot utilization above 97%. Check the uncertainty before you celebrate. Reported intervals were roughly ±3.2 and ±4.1 orders per hour respectively, so the gap clears the noise, but not by an enormous margin. Coordinated dispatching cuts idle travel and contention, which is why the gain depends on layout, order mix, and WMS integration rather than robot count alone.
What Digital Twins and Fleet Analytics Delivered
A modeled organic-food supply chain study ran as many as 40 simulation experiments across multiple volatility scenarios to quantify digital supply-chain-twin adoption in multi-echelon inventory management. The mechanism is straightforward. Real-time operational data updates the twin, planners test replenishment and allocation decisions against changing conditions before executing them, and the lag between disruption detection and corrective action shrinks. A separate food-supply-chain comparison in that work reported approximately 44% lower raw-material inventory, 46% lower work-in-process inventory, and 44% lower distribution inventory, with processing time nearly 48% lower than the conventional configuration. Simulation results aren't field results, so treat the magnitudes as directional until a live flow confirms them.
The video below adds operational context on how these systems behave on a working floor.
Field cases tell a similar story at network scale. A McKinsey analysis of logistics operations describes a food manufacturer that onboarded more than 250 assets, increased capacity by 50%, and ran targeted carrier-sourcing events across 1,000 lanes and 3,000 weekly loads, generating more than $50 million in impact from better dedicated-fleet versus third-party carrier decisions. In another case from the same analysis, a digital twin reduced operating expenses by more than 10%, and a retailer reduced fulfillment and inventory-holding costs by more than 10%, cut air freight by 5%, and improved utilization of a network node by approximately 20%. Agent-based automation is reaching execution too, as in how C.H. Robinson automates 5,500 shipments daily with LangChain AI agents. We structure every case entry the same way, with the company, the situation, the tools used, and a measurable result, so you can compare conditions instead of headlines.
| Deployment | Technology | Measure result | Conditions to check |
|---|---|---|---|
| Robot-assisted warehouse experiment | Robots with algorithmic task allocation and routing | About 120 vs 105 orders per hour; robot utilization above 97% | Order size mix, congestion controls, WMS integration |
| Organic-food supply-chain twin study | Digital supply-chain twin | About 44% lower raw-material and distribution inventory, 46% lower work-in-process, processing time nearly 48% lower in a separate comparison | Volatility of flows, data connected to inventory and orders |
| Food manufacturer (McKinsey analysis) | Fleet and carrier visibility with analytics | 250+ assets onboarded, capacity up 50%, over $50 million impact | Lane-level data, carrier sourcing events |
| Operator with digital twin (McKinsey analysis) | Digital twin | Operating expenses down more than 10% | Baseline cost, network scope |
| Retailer (McKinsey analysis) | Network and inventory analytics | Fulfillment and inventory-holding costs down more than 10%, air freight cut 5%, node utilization up about 20% | Network design, demand patterns |
Each result depends on layout, order mix, volatility, and integration quality. Before you copy a number into a business case, ask what the baseline was and whether your operation shares those conditions.
KPIs That Show Whether Technology Is Working
Deployment isn't evidence. A 2026 logistics-industry analysis found that only about one in ten logistics service providers reported measurable financial impact from AI, and just 13% reported measurable value from embedding AI into daily operations. The measures that count are unit costs, service levels, and margins, so define your baseline before go-live and measure change against it.
| KPI | How to calculate | Baseline to capture | Applies to |
|---|---|---|---|
| Orders per hour | Orders shipped divided by productive labor or robot hours | Prior quarter, split by small, medium, and large orders | Warehouse |
| Robot utilization | Active robot time divided by available time | Current robot idle share | Warehouse automation |
| Peak on-time delivery | On-time deliveries divided by all peak-period deliveries | Peak weeks from last year | Fulfillment and transport |
| Dock or port dwell time | Departure time minus arrival time, by shipment type | Median and spread per lane | Transport and yards |
| Lead time | Order release to delivery confirmation | Median by product family | End-to-end supply chain |
| Cost per shipment | Total transport and handling cost divided by shipments | Monthly, by lane | Transport |
| Inventory days by stage | Stock on hand divided by daily usage, for raw, in-process and finished goods | Month-end snapshot | Inventory planning |
| Forecast accuracy | Absolute percentage error between forecast and actual demand | Last four forecast cycles | Demand planning |
| Exception rate | Exceptions per 100 shipments or orders | Weekly count by cause | Control towers |
Reading the Numbers Without Fooling Yourself
The calculations are deliberately simple. Orders per hour is orders shipped divided by productive hours. Robot utilization is active robot time divided by available time. Peak on-time delivery counts on-time deliveries at peak over all peak deliveries, because a system that only works in quiet weeks hasn't solved your problem. Dock dwell runs from arrival to departure, and forecast error is the absolute percentage gap between forecast and actual demand.
Separate measured results from estimates. A 2025 sustainability study of digital technologies in supply chains reported an integrated AI and analytics deployment where the participating organization estimated a 20% reduction in lead times and a 15% decrease in operational costs, and the authors explicitly characterized those figures as self-reported estimates that were not independently verified. Treat numbers like that as hypotheses to test in your own pilot, not as expected returns.
Report every KPI by order size or lane, never only as a site average. Aggregates hide the bottlenecks, which usually sit in large-item handling and replenishment.
Where Pilots Stall and Which Decisions Stay Human
AI adoption does not guarantee operational gains. A 2025 PwC operations survey reported that 57% of operations and supply-chain leaders had introduced AI in at least some functions, while 92% said technology investments had not fully delivered expected outcomes. Data fragmentation and integration complexity were among the obstacles. Pilots often stall when teams try to fit imperfect data from multiple companies into a process that has not been redesigned around it.
The barrier list reinforces that point. The same coverage cites a warehouse-technology study that ranked technical expertise (48.6%), system integration (47.7%), data quality (46.2%), and implementation cost (46.1%) as leading barriers. Employee resistance and training affected 39.7%, and ROI uncertainty affected 30.5%. Two of the top four barriers, system integration and data quality, concern connecting and trusting data, not algorithm sophistication.
Full Autonomy Is the Wrong Target
Supply-chain technology works best when automation is assigned by decision risk. Gartner's 2026 outlook on top supply chain technology trends groups agentic AI, physical AI, intelligent simulation, and AI governance. Together, these areas point to a stack that must connect sensing and execution with traceability and guardrails. Prediction alone cannot close the gap between a recommendation and an operational result. A 2026 European logistics survey summarized alongside that outlook reported 52% of businesses using AI in some way, while only 5% had successfully scaled it across operations. Scaling depends on the operating model as well as the model itself.
Assign decisions according to how quickly they must be made and what happens if they are wrong:
- Machine-led, with human review: Re-routing shipments around a closure, forecasting demand, detecting exceptions, and dispatching warehouse robots. These tasks benefit from speed, and errors can often be reversed.
- Human-approved: Supplier changes, regulatory judgments, safety-critical moves, and customer-impacting exceptions such as cancelling or expediting a strategic account's order. These decisions carry higher accountability or greater cost if reversed.
Before automating a workflow, assess error cost, reversibility, latency, accountability, and workforce acceptance. High error cost and low reversibility call for human approval, even when a system makes the recommendation. Tight latency and reversible errors can justify machine action, followed by a human review of the log.
Set a baseline before the pilot. Track exception rates and service levels so that fewer exceptions, more reliable service, or avoided disruption can be assessed against the operation's prior performance.
Operating rule: The most advanced system isn't the one with the fewest human decisions. It's the one where every remaining human decision is deliberate.
Assessing Logistics Technology Vendors Before You Buy
Vendors sell a finished outcome, so judge their evidence before their demo. The checklist below sequences the questions that separate a proven deployment from a polished presentation.
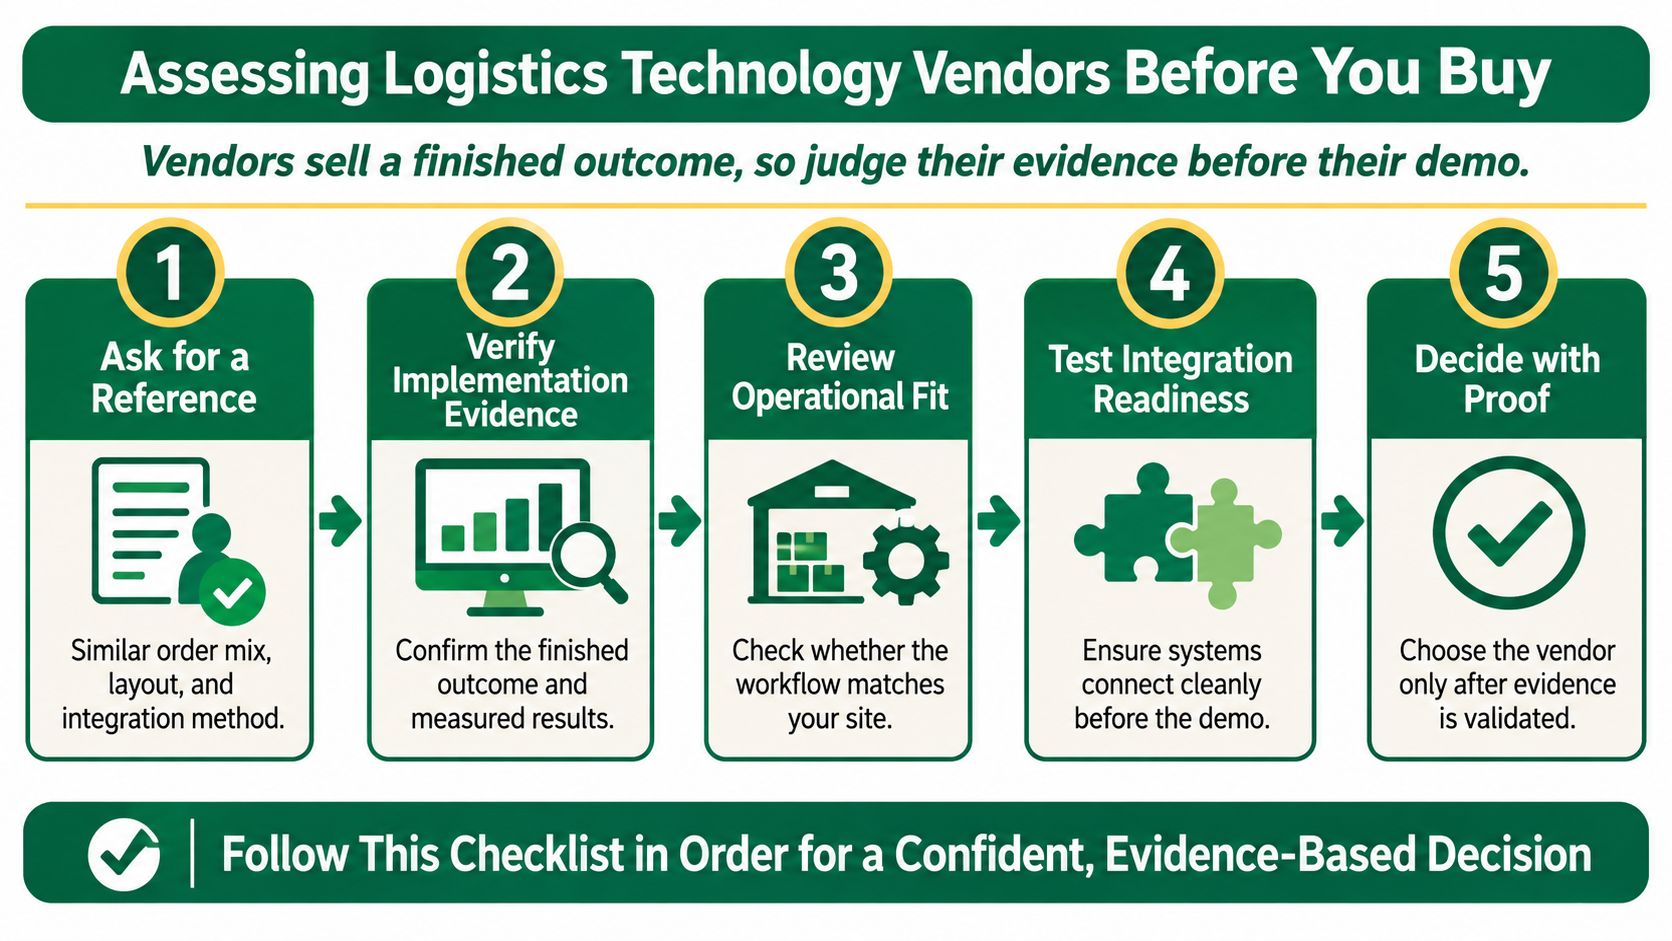
Seven Questions in Order
- Ask for a comparable reference: Same order mix, similar layout, and the same integration method you'd use, not just a recognizable logo.
- Request the baseline and the post-pilot measurement: Both numbers, for the same KPI, over a stated period. One number without the other is marketing.
- Separate standard integrations from custom work: Get the custom items estimated in weeks, with named owners on both sides.
- Ask how the system handles missing or late partner data: Carrier feeds fail. You want graceful degradation and clear flags, not silent guesses.
- Confirm who owns the event data and how you export it: Your shipment history is your negotiating asset at renewal time.
- Check the scope of claimed results: Measured on one workflow or across the whole operation? A single-lane win doesn't prove network value.
- Ask what the vendor will not do: A credible vendor names its limits, such as refusing to auto-approve safety-critical decisions.
Cross-check every claim against public evidence. Job postings, technical blogs, company announcements, and customer references show which tools organizations are hiring for and deploying, and they often contradict sales timelines. We rank tools and vendors using exactly that kind of public company evidence, including job postings, use cases, technical blogs, and company references, because hiring and deployment signals are harder to fabricate than case-study PDFs.
A vendor without a measured baseline is offering a demo, not evidence. Price accordingly, or walk away.
Build a 90-Day Logistics Technology Pilot Plan
Ninety days is enough to prove or kill one use case if you protect the scope. The timeline below divides the work into three phases, and each phase ends with a decision, not a status update.
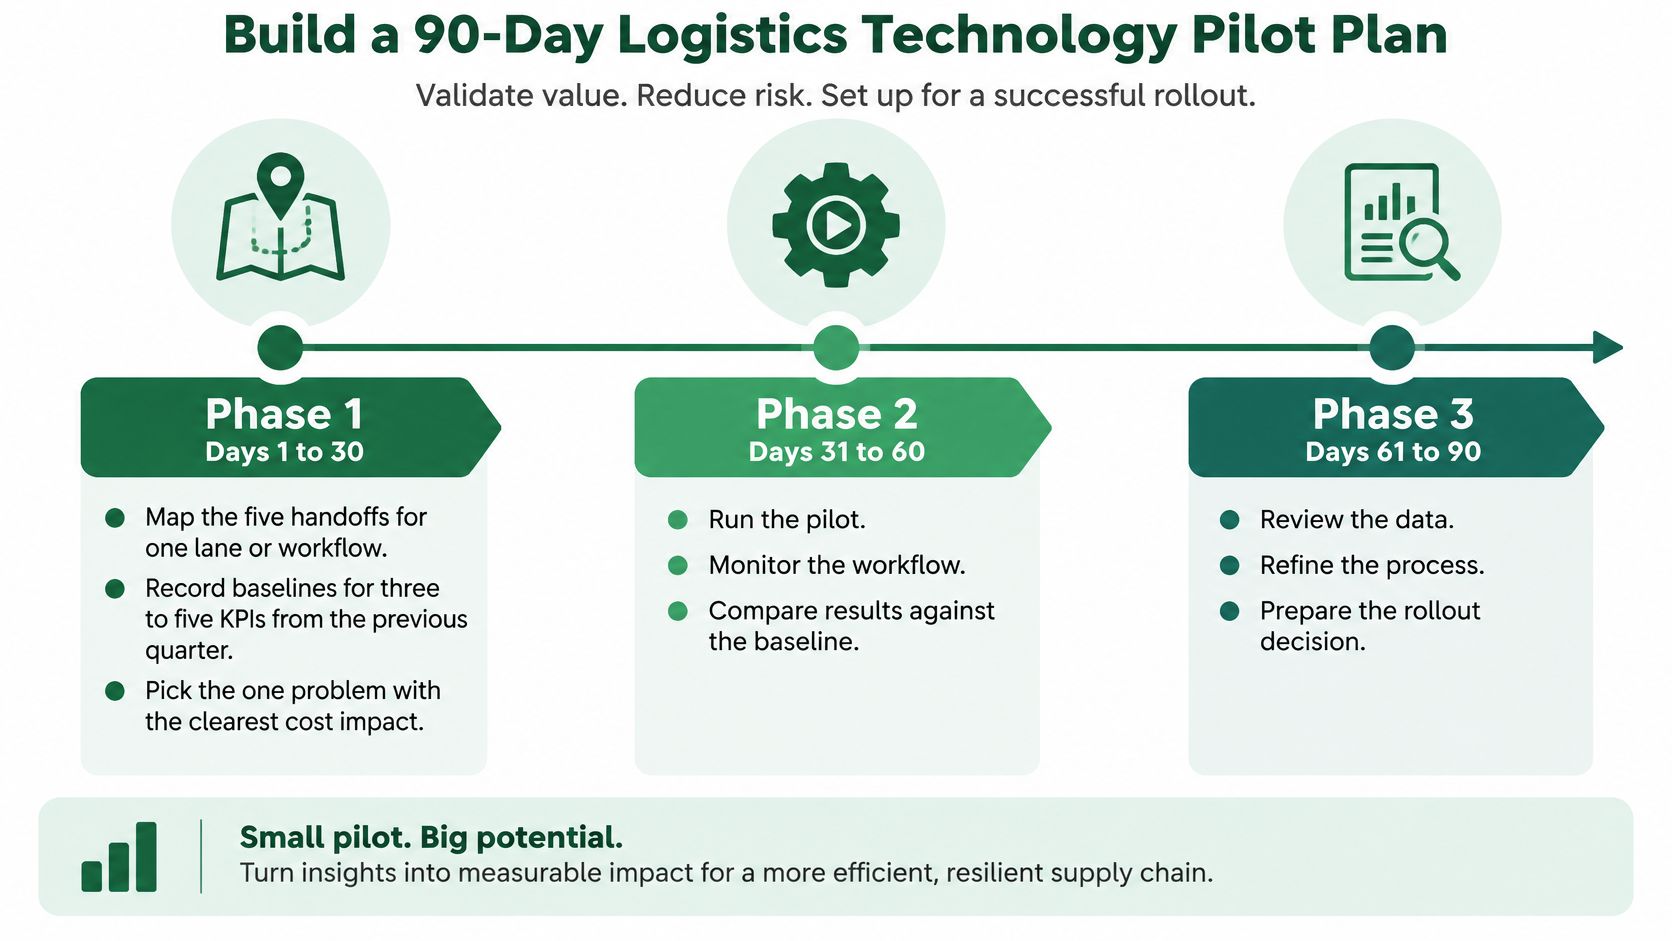
Days 1 to 30 Map and Baseline
Pick one lane or one workflow and map its five handoffs, from order release to proof of delivery. Record baselines for three to five KPIs from the previous quarter, split by order size or lane, and write down the data definitions so finance and operations argue about the same numbers. Then choose the single problem with the clearest cost, such as dock dwell on your largest inbound lane or exception rate in one fulfillment node. Resist adding a second use case. Every extra scope item multiplies integration work and muddies attribution.
Days 31 to 60 Run Beside the Current Process
Connect the pilot to shared data definitions first, then run it beside the current process on a defined share of volume. Review results weekly against the baseline, by order size or lane, and log every manual workaround your team invents. Those workarounds are diagnostic gold. They show exactly where partner data arrives late, where an event definition is ambiguous, and where operators don't trust the system's recommendation.
Calibrate your ambition against the market's actual pace. In 2025, 54% of shippers and carriers surveyed by Transporeon expected to automate no more than 25% of their transportation processes by the end of the year, according to the Transporeon Transportation Pulse Report 2025. Hardware adoption shows the same measured pattern. In 2024, 46% of companies surveyed in Modern Materials Handling's intralogistics robotics survey were already using one or more types of robots, while 33% planned to adopt robots within three years. A pilot covering a focused slice of volume puts you in the serious minority, not behind it.
Days 61 to 90 Decide and Document
Compare pilot KPIs with the baseline and decide to scale, redesign, or stop. Use your measured delta in unit cost, service level, or exception rate, not the vendor's reference numbers. Write down which decisions remain under human approval, who owns each event definition going forward, and what integration work scaling will require in weeks. If the result is redesign, that's a successful pilot. You've bought the knowledge cheaply.
Applied is an AI adoption intelligence platform that tracks real AI use cases, tools, vendors, and adoption signals across companies, with source-backed evidence and weekly research, so you can benchmark your pilot against documented deployments instead of vendor claims. Create an account to access the library of AI use cases and tools organized by industry, business function, and outcome, and talk to us about consulting when you need hands-on help. Applied helps teams with AI strategy, education, and hands-on implementation, and offers consulting and implementation services for exactly this stage, where a promising pilot has to become an operating system.
Applied tracks verified AI implementations in logistics and beyond, each with the company, situation, tools, and measurable result, so your next technology decision starts from evidence instead of a demo. Create an account at Applied to subscribe for access to the library of AI use cases and tools by industry, business function, and outcome, and use it to shortlist vendors before your 90-day pilot begins.