AI in Supply Chain Management: A Practical Guide
Learn how AI in supply chain management drives measurable results, from demand planning and inventory to routing, risk monitoring, and governance.
October 12, 2026
78% of organizations now use AI in at least one business function, yet only 7% use it across supply-chain operations overall. That gap captures the actual state of AI in supply chain management. Interest has moved into the boardroom, but measurable value still depends on whether a planning, procurement, or logistics team changes its daily decisions and produces an independently verified economic result.
The practical question isn't whether a model can forecast demand, summarize supplier messages, or suggest a route. It's whether the recommendation reaches the right operator, fits the existing process, survives exceptions, and improves inventory, service, cost, or resilience without creating an untracked risk. The projects that scale treat AI as an operating capability, not as a collection of impressive demos.
Table of Contents
- Where AI Lands in Supply Chains
- Forecasting That Improves Inventory Economics
- High-Impact Use Cases and the Metrics That Matter
- A Real Enterprise Example Worth Studying
- The Implementation Roadmap in Practice
- Measuring AI Maturity the Hard Way
- Governance, Trust, and the Human-in-the-Loop Reality
Where AI Lands in Supply Chains
78% of respondents said their organizations used AI in at least one business function, up from 72% in early 2024 and 55% a year earlier, according to McKinsey's State of AI research. Supply-chain deployment remained narrower: only 7% used AI across supply-chain operations overall. Adoption reached 15% in advanced industries, 14% in consumer goods and retail, and 10% in technology.
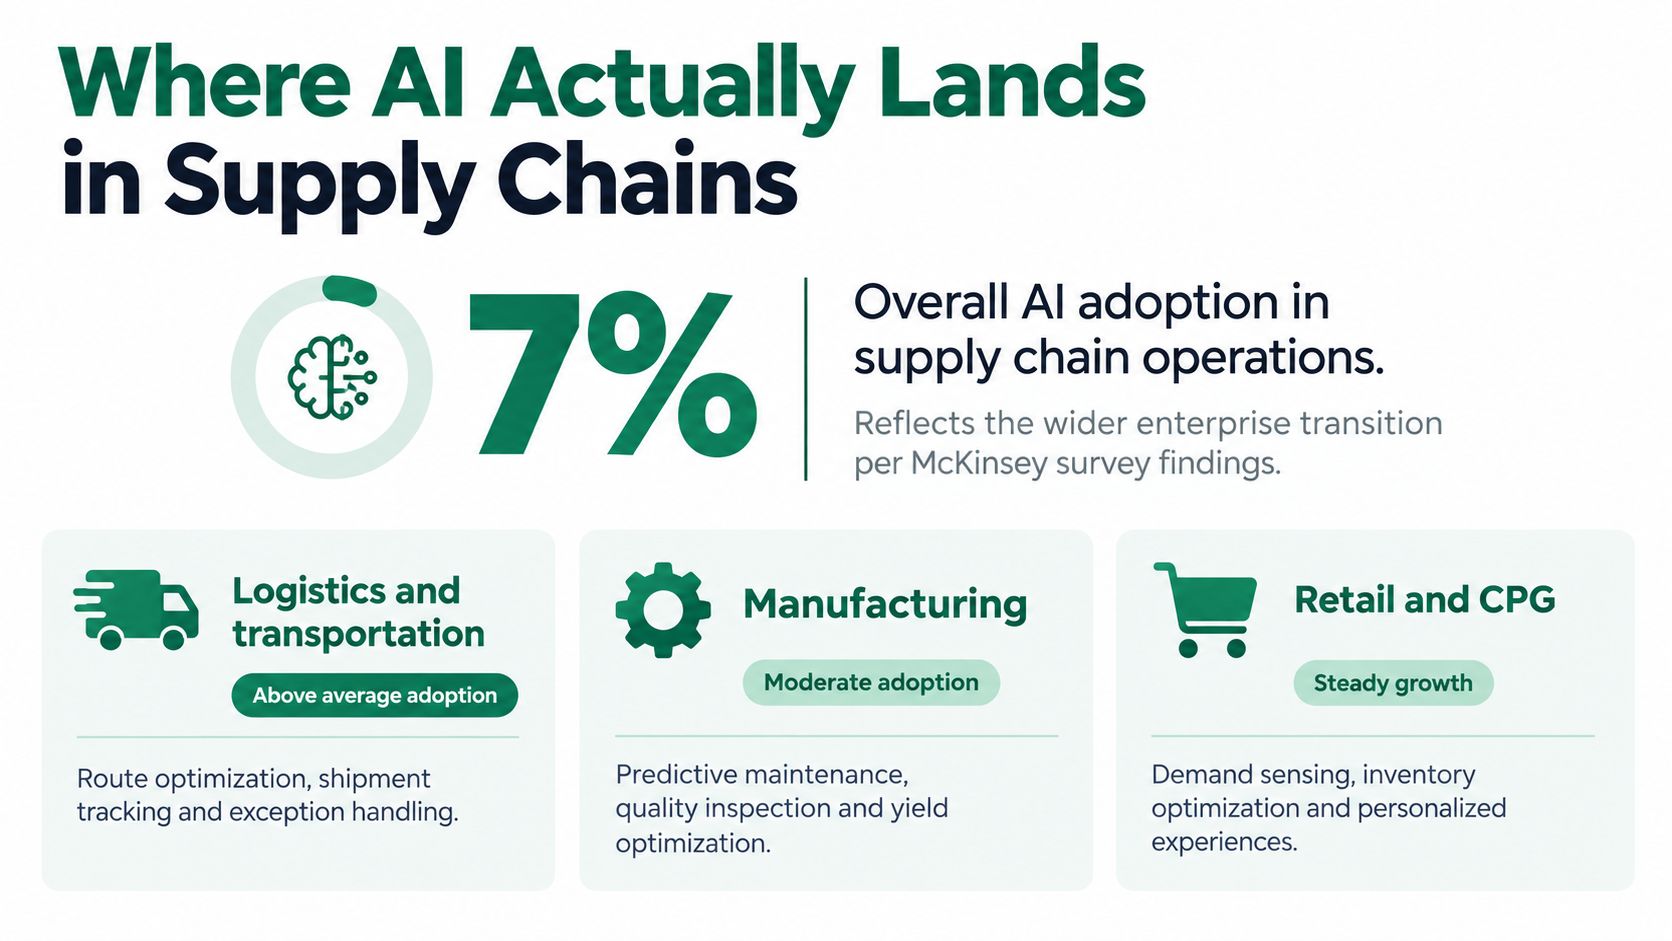
The gap separates enterprise experimentation from operating value. A company may run a marketing copilot, a software engineering assistant, and generative AI trials while planners still reconcile fragmented item masters, inconsistent lead times, and spreadsheets by hand. Broad AI adoption doesn't equal supply-chain-wide deployment.
Start where the decision loop is visible
The best starting processes share three conditions:
- Structured operating data: Demand history, orders, inventory positions, shipment events, supplier performance, and production records give models usable inputs.
- Frequent decisions: Replenishment, allocation, routing, and risk triage create repeated chances to compare recommendations with outcomes.
- A measurable economic consequence: Teams can connect a decision to working capital, transport spend, stockouts, service level, or planner time.
Data-rich, asset-intensive sectors often provide stronger entry points because their operations produce repeatable signals and decisions affect physical flow quickly. Sparse data, unstable processes, and limited automation can constrain value more than model quality. A technically accurate recommendation still fails if no operator receives it, no system records the action, or exceptions force planners back to manual work.
Map each candidate use case from signal to action. Record where the data originates, who decides, which system captures the decision, and what happens when the recommendation is wrong. A practical guide to supply chain optimization can structure the assessment, but the business case requires a local baseline, a control group, and an owner for adoption.
Teams can also review the Supply Chain and Ops adoption signals across planning, logistics, procurement, and risk. Popularity is not a maturity measure. Repeatable use in a defined process, followed by independently measured economics, is the stronger test.
Forecasting That Improves Inventory Economics
Forecast accuracy matters only when it improves the inventory and service trade-off. A lower error score can still create excess safety stock, unstable replenishment, or costly shortages if systematic bias reaches the planning process.
Small shifts in forecast behavior affect several decisions at once. Persistent overforecasting raises order quantities and holding costs. Underforecasting can reduce stock while increasing shortage penalties, expedites, and lost service. Instability across planning periods creates manual overrides, and those overrides can weaken the policy the model was intended to improve.

Use a cost-based benchmark
A controlled retail benchmark compared models with identical preprocessing, training, and evaluation conditions. The datasets contained up to 913,000 daily sales records and 1,115 stores. XGBoost produced the lowest modeled total inventory cost at $656,709, 14.7% below the worst-performing CNN–LSTM model at $769,672. The gap represented roughly $113,000 over five months, or about $270,000 annualized (the Frontiers benchmark).
Model selection should reflect the operating objective, not leaderboard accuracy. Tree-based ensembles can suit structured tabular demand data when feature quality and decision-oriented cost functions matter more than architectural complexity. A deeper model may appear more advanced while producing a less economical inventory policy.
Build the evaluation around the decisions the forecast will drive:
- Define service constraints. Set the required service level or fill-rate condition before comparing models.
- Price both sides of error. Include holding costs, shortage costs, replenishment constraints, and working-capital effects.
- Separate operating conditions. Evaluate promotions, seasonality, product groups, and volatile items separately rather than hiding them in an aggregate score.
- Test each planning horizon. A model suited to short-term replenishment may fail in medium-term capacity planning.
- Measure bias as well as error. Track consistent overstatement and understatement of demand.
The Applied guide to AI for demand forecasting connects demand signals with inventory and supply decisions. A strong pilot starts with one category, region, or planning horizon where the baseline process is understood. Compare the AI recommendation with the existing forecast, record planner acceptance, and connect accepted decisions to inventory and service outcomes.
Practical rule: Do not approve a forecasting model because it wins a leaderboard. Approve it when its decisions improve the cost and service trade-off under the conditions your planners face.
High-Impact Use Cases and the Metrics That Matter
AI creates supply-chain value through repeatable decisions. Each use case needs an operating KPI, a financial interpretation, and an adoption measure showing whether planners and systems consistently act on the output. Model accuracy is only an entry condition. Scaled value appears when the recommendation changes a process and finance can independently confirm the result.
Industry-cited research compiled at the documented supply-chain AI results associates AI-enabled distribution operations with 20% to 30% lower inventory, 5% to 20% lower logistics costs, and 5% to 15% lower procurement spend. The same source associates AI-driven demand forecasting with roughly 20% to 50% lower forecast error than traditional statistical approaches. These ranges describe reported improvements, not guaranteed returns. Results depend on the starting process, data quality, policy changes, and whether teams use the recommendations.
| Use case | Reported improvement range | Primary KPI |
|---|---|---|
| Demand forecasting | 20% to 50% lower forecast error | Bias, error by horizon, service level |
| Inventory optimization | 20% to 30% lower inventory in documented distribution research | Inventory turns, days on hand, stockout rate |
| Logistics optimization | 5% to 20% lower logistics costs in documented distribution research | Cost per shipment, on-time performance |
| Procurement analytics | 5% to 15% lower procurement spend in documented distribution research | Addressable spend, negotiated value, supplier performance |
Match the capability to the bottleneck
Demand forecasting fits a planning process that reacts slowly to demand changes. Test more than error reduction. Track bias, replenishment changes, stockouts, excess inventory, planner overrides, and the share of recommendations accepted.
Inventory optimization produces value only when the business can change safety-stock, reorder, or allocation policies. A dashboard that identifies excess stock while policies remain unchanged creates visibility without economic improvement. Measure inventory position with fill rate, service-level attainment, working capital, and policy adoption.
Logistics optimization suits networks where routing complexity gives dynamic planning an advantage over fixed schedules. Compare transport cost per shipment, fuel consumption, delivery cycle time, fleet utilization, and on-time performance. A shorter route that misses its delivery window has failed the operating objective.
Procurement analytics must connect supplier and spend intelligence to sourcing actions. Track spend coverage, lead-time adherence, quality, delivery reliability, negotiated value, and the decisions procurement teams implement. Savings recorded in a dashboard but absent from invoices or purchasing behavior should not count as realized value.
Predictive maintenance belongs in the same operating conversation. A risk signal matters when it changes a maintenance schedule, prevents avoidable downtime, or improves asset availability. Guidance on feature engineering for maintenance data shows why sensor selection and feature quality can matter more than adding model complexity.
The recurring failure is stopping at recommendations. A use case reaches scale when its output enters an ERP, warehouse, transport, or procurement workflow, a person or agent makes a controlled decision, and finance and operations accept the resulting KPI. Track adoption and independently measured economics alongside model performance. That is the practical test of AI maturity.
A Real Enterprise Example Worth Studying
IBM's cognitive supply-chain program shows how enterprise AI creates value when it connects analysis to decisions across sourcing, inventory, transport, and disruption response. The operating design matters more than the product name: teams need usable recommendations, clear action paths, and financial measures that can be checked independently.

IBM reported using Watson technology for natural-language queries, faster decisions, and support for re-sourcing and re-routing parts during disruptions. The program covered a global operation involving more than 10 million shipments and 350,000 stock-keeping units, serving demand from over 170 countries. IBM reported approximately USD 160 million in savings through lower inventory costs, optimized shipping, faster decisions, and time savings (the documented IBM supply-chain example).
The decision loop was broad. Performance depended on more than answering questions accurately. The system supported sourcing, routing, inventory, and operational response, allowing the organization to compare those actions with cost and service results. That connection between recommendation and execution is the part other companies can test.
During the COVID-19 pandemic, IBM also reported maintaining a 100% order-fulfillment rate by adapting sourcing and routing quickly. The example shows how resilience can belong in the value case. Lower inventory and shipping costs are measurable benefits, while continuity protects service when supplier and transport assumptions stop holding.
What transfers to other organizations
The transferable pattern is the combination of the following four elements, with the Watson brand serving as only one implementation choice:
- A defined operational scope: The system addressed decisions involving parts, shipments, sourcing, and routing.
- Natural-language access to operational data: Teams could ask questions without waiting for every analysis to be prepared manually.
- Action pathways: Recommendations could affect sourcing and routing instead of remaining in a reporting layer.
- A broad outcome definition: Savings included inventory, shipping, decision speed, time, and continuity.
A smaller organization should apply the same logic to a narrower workflow, such as one product family, one supplier-risk process, or one high-volume transport lane. The practical test is repeatability. Does the pilot change a decision consistently, and can finance and operations isolate its financial and service effects from normal variation?
Governance must scale with the decision. Re-sourcing a part or re-routing a shipment can protect continuity, but it can also affect supplier commitments, customer promises, cost, and compliance. Speed requires permissions, thresholds, and an audit trail. Without them, a useful recommendation becomes an accountability problem before it becomes a scaled capability.
The Implementation Roadmap in Practice
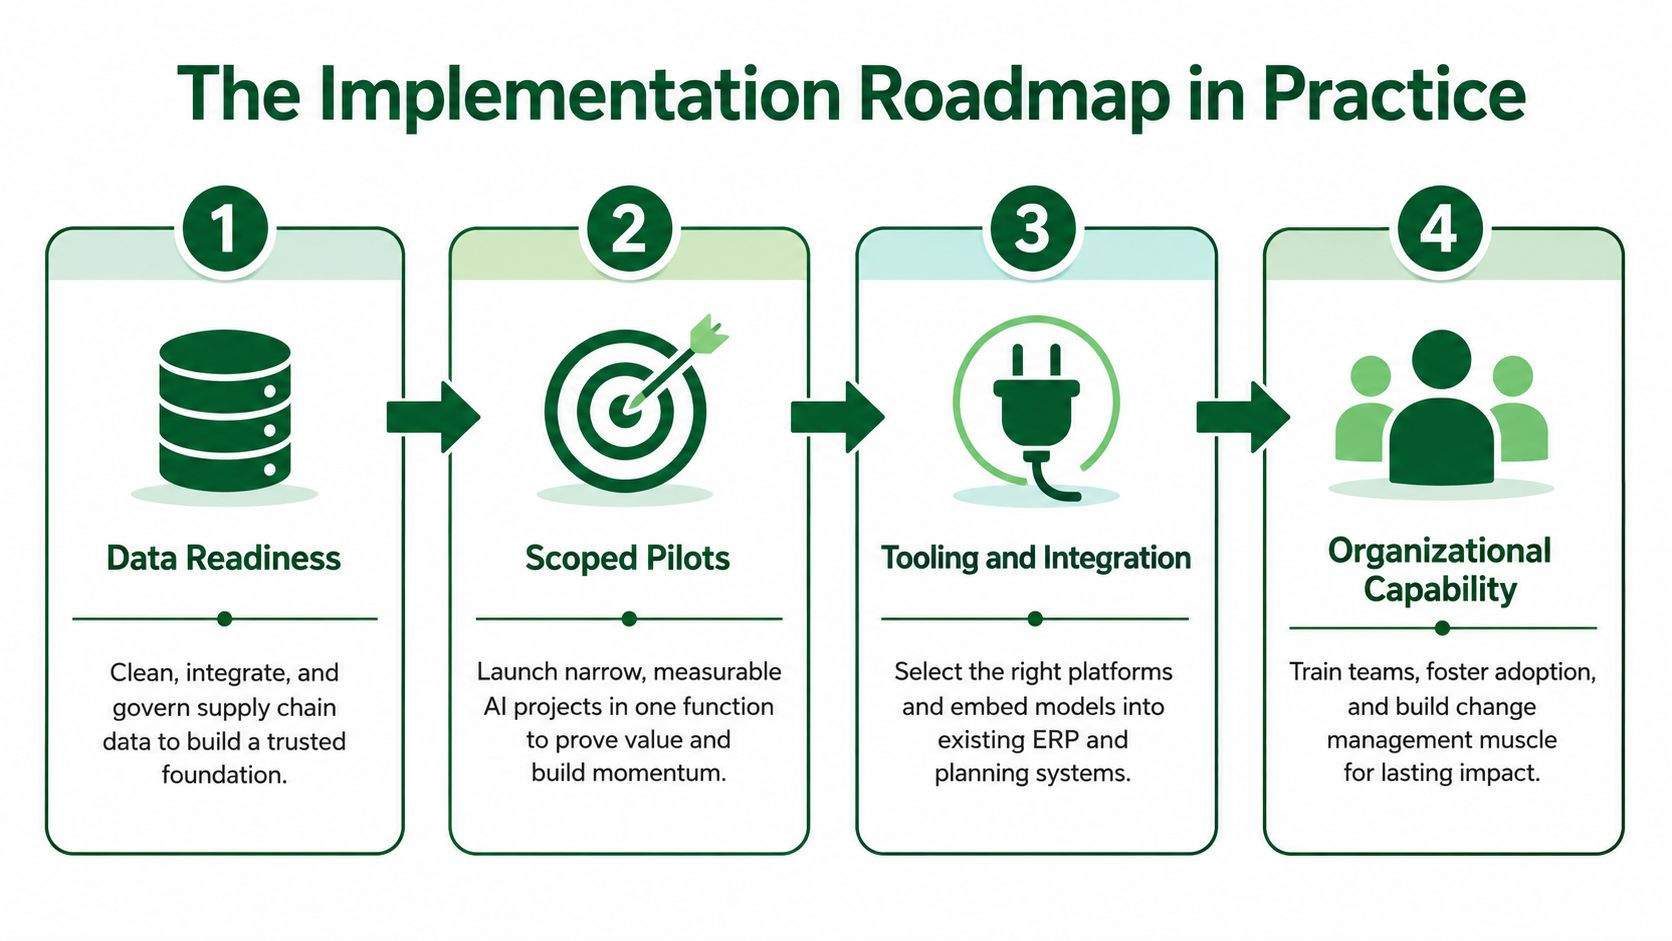
The execution gap usually appears before the first model reaches production. A global survey of more than 200 supply-chain executives and practitioners found that only 22.2% had deployed AI at scale across multiple teams or made it core to operations, while 43.2% were still experimenting or had not started. The largest reported obstacle was insufficient in-house expertise and change-management capability at 53.8%, followed by integration difficulty at 48.7% (the survey on AI adoption barriers).
Start with data ownership
Inventory the data required for the decision, not every dataset in the business. For a demand pilot, that may include sales, orders, inventory, promotions, lead times, and stockout records. Assign owners for definitions, quality checks, lineage, and exception handling.
The go or no-go question is simple: can the team reproduce the baseline and explain which records entered the model? If not, model tuning is premature.
Scope the pilot around one measurable constraint
Choose a narrow process with a clear operator and economic exposure. A single product group with recurring stockouts is more useful than an enterprise-wide forecasting ambition. Define the baseline, decision window, success metric, and control or comparison method before the pilot begins.
Instrument both model and process behavior:
- Recommendation quality: Forecast bias, error, risk precision, or route feasibility.
- Adoption: Planner acceptance, override reasons, execution rate, and exception volume.
- Business effect: Inventory, service level, expedite spend, transport cost, or supplier performance.
- Operational burden: Planner hours, data corrections, support tickets, and cycle-time changes.
Integrate with the systems people already use
A separate dashboard can prove that a model works in theory. It rarely proves that the organization can operate it. Define how recommendations enter the ERP, planning system, transportation management system, warehouse system, or procurement workflow. Test failure states, stale data, rejected recommendations, and conflicting updates before expanding.
The Applied implementation roadmap provides a useful reference for sequencing pilots, integration, and organizational capability. Applied can also be considered alongside internal platforms and specialist vendors when teams need to compare AI use cases and tools by function.
Build capability before scaling
Train planners and buyers on model limitations, confidence, overrides, and escalation. Give process owners authority to pause the system when data quality falls or behavior drifts. Make the scale decision jointly with operations, finance, IT, and risk, because a model that improves one KPI while damaging another hasn't delivered a complete result.
Scale only what the process can absorb. A technically sound model still fails when nobody owns the exceptions, the integration is fragile, or the operator has no reason to trust the recommendation.
Measuring AI Maturity the Hard Way
AI maturity isn't the number of copilots deployed, models trained, or dashboards launched. It's the ability to show that a process repeatedly adopts AI-supported decisions and that those decisions produce an independently measured economic outcome.
A credible measurement design starts before implementation:
- Baseline period: Record the current process, cost, service, and workload under normal conditions.
- Comparison method: Use a control group, matched product set, prior-period comparison, or another defensible method to separate AI impact from demand and network changes.
- Adoption measure: Track recommendations accepted, overridden, executed, and escalated. Adoption without execution is only interest.
- Economic KPI: Connect the process to inventory turns, forecast bias, expedite spend, service level, transport cost, supplier performance, or planner hours.
- Payback decision: Define what improvement justifies the implementation, integration, support, and change-management cost.
The same model can be valuable in one process and uneconomic in another. A demand forecast may improve error while increasing inventory because planners raise buffers. A routing algorithm may reduce distance while increasing late deliveries. A supplier-risk alert may identify genuine threats but overwhelm buyers with false positives.
Choose the right automation level
Recommendation is appropriate when the process is new, the cost of a wrong action is high, or the data needs observation. The system suggests, and a planner decides.
Human approval fits decisions with material supplier, customer, financial, or service consequences. The operator reviews the evidence, records the decision, and can explain the exception.
Autonomous execution should be reserved for bounded, reversible, low-risk actions with stable data and clear thresholds. The system still needs monitoring, permissions, and an immediate way to stop or reverse its behavior.
This framework changes the vendor conversation. Ask what process changed, what baseline was used, which decisions were executed, and how finance validated the result. A growing model inventory is not maturity unless the operating organization can reproduce the outcome.
Governance, Trust, and the Human-in-the-Loop Reality
Trust is an operating requirement. Recent survey evidence found that only 10% of respondents were comfortable allowing AI to make some supply-chain decisions independently, while 54% preferred a hybrid model in which AI recommends actions and human planners decide whether to implement them. An Institute for Supply Management survey found that 86% agreed data governance is necessary, but only 65% reported having a dedicated data-governance function (the survey evidence on supply-chain AI trust).
A practical control framework should define:
- Permissions: Which systems and records can the model read or write?
- Decision thresholds: Which actions need approval because they affect spend, suppliers, customers, or service?
- Exception queues: Where do low-confidence or unusual recommendations go?
- Audit logs: Which data, model version, recommendation, approver, and outcome are recorded?
- Impact review: How are supplier, customer, safety, compliance, and financial effects assessed?
- Post-decision learning: How do overrides, failures, and reversals improve the process?
Teams evaluating agentic workflows can use practical guidance on how guardrails work in business to think through boundaries between automation and approval. Human-in-the-loop design isn't merely a temporary concession to cautious users. For high-impact decisions, it can be the economically rational model until data quality, monitoring, and accountability are mature.
AI in supply chain management reaches scale when people can trust the decision, explain the decision, and reverse the decision. That is the answer to the execution gap. The model matters, but the controlled process around it determines whether value survives contact with the network.
Applied shows how organizations deploy AI through verified case studies, measurable outcomes, and a practical library of tools by industry and business function. Visit Applied to compare supply-chain use cases, evaluate implementation patterns, and find evidence you can use to prioritize your next pilot.