Trade Promotion Management Guide for 2026
Trade promotion management turns retailer deals into incremental profit. See why most promotions lose money and how to plan, measure, and implement TPM.
November 2, 2026

Seventy-two percent of U.S. trade promotions lost money, according to a Nielsen analysis cited by McKinsey, despite consumer-packaged-goods companies globally investing approximately 20% of revenue in trade promotions; globally, 59% lost money, and best-in-class promotions generated five times the return of the least-efficient events. The commercial-finance question isn't whether a discount increased shipments. It's whether the manufacturer earned more after shopper demand, portfolio displacement, retailer claims, and post-promotion depletion were accounted for.
Table of Contents
- Why Most Trade Promotions Lose Money
- What Trade Promotion Management Actually Controls
- How to Separate Lift From Incremental Profit
- The Planning to Settlement Operating Cycle
- How TPM Systems Connect Data and Decisions
- A Practical TPM Implementation Roadmap
- Judge TPM Vendors by Evidence
Why Most Trade Promotions Lose Money
Consider a grocery manufacturer funding a temporary price reduction and an endcap display. The retailer orders extra cases, sales reports a successful event, and the account manager starts negotiating the next promotion. Finance hasn't received the display claim yet, and nobody has checked whether shoppers bought more over the full purchase cycle.
The apparent success contains several unresolved liabilities. Some shipments may still sit in the retailer's warehouse. Some shoppers may have bought the promoted pack instead of another product from the same manufacturer, while others brought forward purchases they would've made later.
Trade promotion management is the discipline and system that plans retailer incentives, funds them, checks execution, settles claims, and judges incremental profit.
Think of TPM as a lock on the promotional wallet, not a prettier discount calendar. The lock should require evidence before funding is committed and a reconciliation after the event closes.
One event, competing definitions of success
Sales negotiates the deal. Finance estimates the deduction and closes the accrual. Supply chain handles the order spike, while category management evaluates shelf placement and the effect on the assortment.
Each team can meet its own objective while the manufacturer loses money:
- Sales can deliver shipment targets by encouraging retailer inventory accumulation.
- Supply chain can fulfill the order while incurring avoidable handling or production costs.
- Category management can secure a display without establishing whether it creates portfolio demand.
- Finance can reconcile the claim correctly without proving that the underlying promotion deserved funding.
A sound approval therefore needs more than an account budget and a volume forecast. It needs distinct outcome definitions, a credible test of incrementality, an operating cycle that reaches settlement, and a data record that connects the commercial agreement to the final margin.
Software becomes useful when it enforces those decisions across functions. Without shared ownership, teams can automate the same disagreement they previously maintained in spreadsheets. A losing promotion is often a measurement and governance failure before it's a forecasting failure.
What Trade Promotion Management Actually Controls
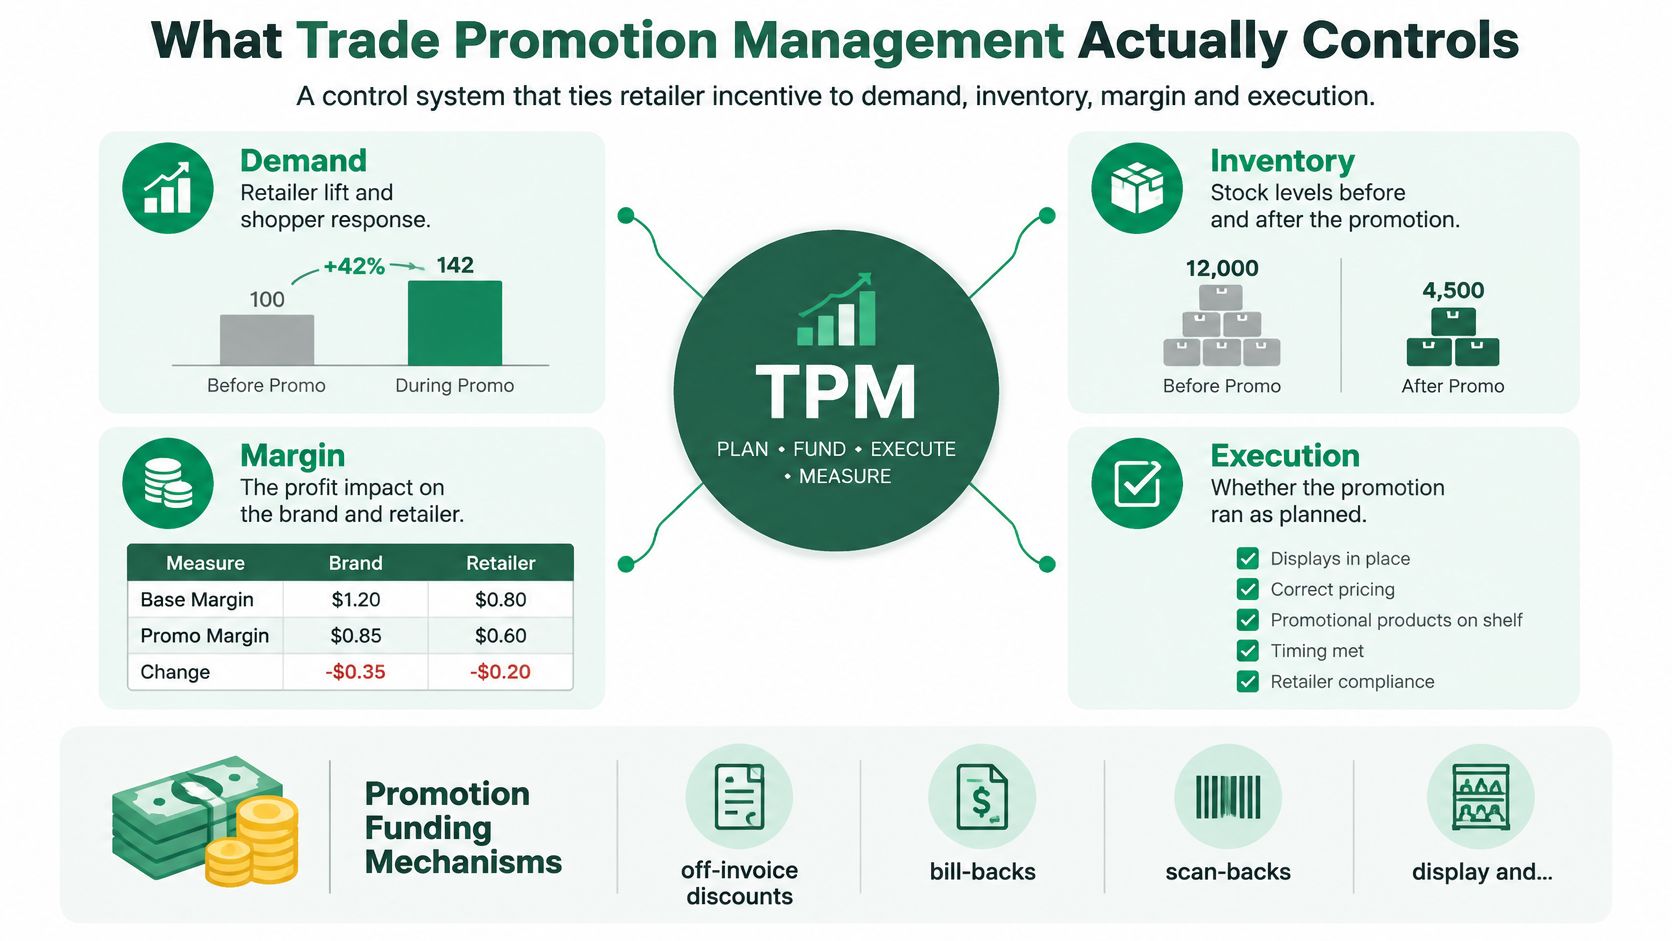
A trade promotion can increase shipments without increasing shopper demand or profit. Trade promotion management (TPM) links demand, inventory, margin, and execution, so the planned incentive, product flow, retailer claim, and financial result refer to the same event.
The funding can take several forms: off-invoice discounts, bill-backs, scan-backs, display and slotting lump sums, and co-op ads. Their eligibility rules matter. An invoice discount, a payment tied to scanned units, and a fixed display commitment create different obligations and require different evidence at settlement.
Manufacturers spend heavily on trade promotion, but only part of the funded value typically reaches shoppers. Strategy&'s promotion analysis describes individual-event ROI ranging from negative 100% to more than 700% and promotional-volume predictions generally within approximately plus or minus 5% to 10%. Those ranges make a key distinction: a forecast can be accurate while the event still destroys margin, and a large lift does not prove that the promotion caused profitable demand.
Outcomes TPM must not treat as the same number
| Outcome | Usual proxy | TPM measure | Why the call changes |
|---|---|---|---|
| Funded value reaching the shelf | Deal rate offered to the first buyer | Pass-through at wholesale, retail, and across the channel | Funded value doesn't transfer uniformly to shoppers |
| Event return | Volume lift versus last year | Event ROI after a true baseline | A shipment increase doesn't establish profitability |
| Volume forecast | Account manager estimate | Statistical baseline | Forecast accuracy and investment return are different tests |
| Sales result | Sell-in during the deal window | Sell-through to shoppers | Forward buying can spike shipments without demand |
| Profit result | Gross sales or scan lift | Net incremental margin after fees | Fixed display and slotting costs can erase a volume win |
| Accounting result | Marketing expense | Revenue deduction unless a distinct retailer service is provided at fair value | Classification changes reported revenue and margin |
These measures govern different decisions. Pass-through informs account negotiations; sell-through informs demand planning; incremental margin informs funding approval. Accounting treatment affects reported revenue and margin, but cannot by itself establish whether the event created value. TPM is therefore a control system for causal decisions and cross-functional accountability, not just a dashboard of promotional results.
Track the transaction, not just the average
Pass-through describes how promotional value moves through the channel. Use transaction-level prices and actual retailer execution to assess whether shoppers received the funded offer. A channel average cannot reconcile an individual promotion or show whether its terms were followed.
The same discipline applies to product cost. An average acquisition cost can blur the difference between regular and promotional purchases. For an event review, retain the transaction cost associated with the relevant units, so an inventory average does not flatter the apparent return.
The control model should keep its operating dimensions visible:
Ask the account team which outcome rows it can calculate with current store data. Where execution or sales data are too weak to establish what shoppers received, optimization claims are impossible to support. Assign a data owner and restrict the related decision until the gap is closed, rather than filling it with a more confident forecast.
How to Separate Lift From Incremental Profit
Lift measures a change. Incrementality attributes that change to the promotion. A strong event evaluation needs a defensible estimate of what shoppers would've bought without the offer.
That counterfactual must account for pull-forward demand, pantry loading, SKU cannibalization, and competitor or channel substitution. Distinguish competitor switching that benefits the manufacturer from switching between its own products, which may add little portfolio value.
Deep Marketing's published synthesis describes a matched-control design with a four-week pre-period, a two-to-four-week promotion, and two to eight post-period weeks, and reports that 53% of promotions across six FMCG categories generated negative economic profit after adjustment for pull-forward and cannibalization.
Establish the counterfactual before launch
Choose comparable stores or regions using historical sales patterns, distribution, assortment, and promotional exposure. Check that treatment and control locations moved similarly before the event. A store with persistent stockouts isn't a credible comparison for a fully stocked treatment store.
Use difference-in-differences to compare the treatment group's change with the control group's change, rather than attributing the entire treatment-store increase to the discount. A geographic holdout can serve the same purpose when shopper movement or retailer execution makes individual-store comparisons unreliable.
Minimum test design for incremental promotion profit
| Design element | Practical setting | What it isolates |
|---|---|---|
| Pre-period | Establish a stable comparison before launch | Baseline and seasonality before the deal |
| Promotion window | Observe the full live offer | Treated lift while the offer is live |
| Post-period | Continue observation through the replenishment cycle | Pull-forward demand and post-deal depletion |
| Control | Matched stores, regions, or a geo holdout | Demand that would've happened anyway |
| Portfolio adjustments | Cannibalization and channel substitution | Volume transferred from other SKUs or channels |
| Required fields | Baseline, assignment, post-event effect, discount, fees, display payments, net margin | Prevents ROI from using gross lift |
| Stop rule | Overlapping events or no usable store-level control | Don't claim a causal ROI |
If store-level data is missing, events overlap inseparably, or no credible control exists, don't publish causal ROI. Cap discount depth, require a documented post-event review, and label the result directional. A model can estimate an outcome under assumptions; it can't turn an unidentified effect into demonstrated incrementality.
Practical rule: Report the evidence grade beside the profit estimate. A precise number with an unsupported counterfactual isn't a precise answer.
Keep the manufacturer and retailer ledgers separate
Calculate manufacturer contribution using the net incremental portfolio effect, applicable unit economics, funded discounts, and fixed event costs. Reconcile trade funding to the financial record so you don't subtract an allowance twice.
Retailer economics need their own view of selling margin, manufacturer funding, and inventory carryover. Manufacturer shipment volume, shopper sell-through, net revenue, and retailer gross margin aren't interchangeable outcomes.
Personalized offers require the same discipline at the eligible-shopper level; AI for personalization is a useful adjacent workflow to evaluate without confusing targeting with causal proof. Pick a completed event and recompute its margin with the post-event window included before approving its repeat.
The Planning to Settlement Operating Cycle
Run the promotion as a closed commercial commitment. Approval, store execution, and financial settlement should preserve the same event identity, even when different teams handle each stage.
The process view makes those handoffs explicit:
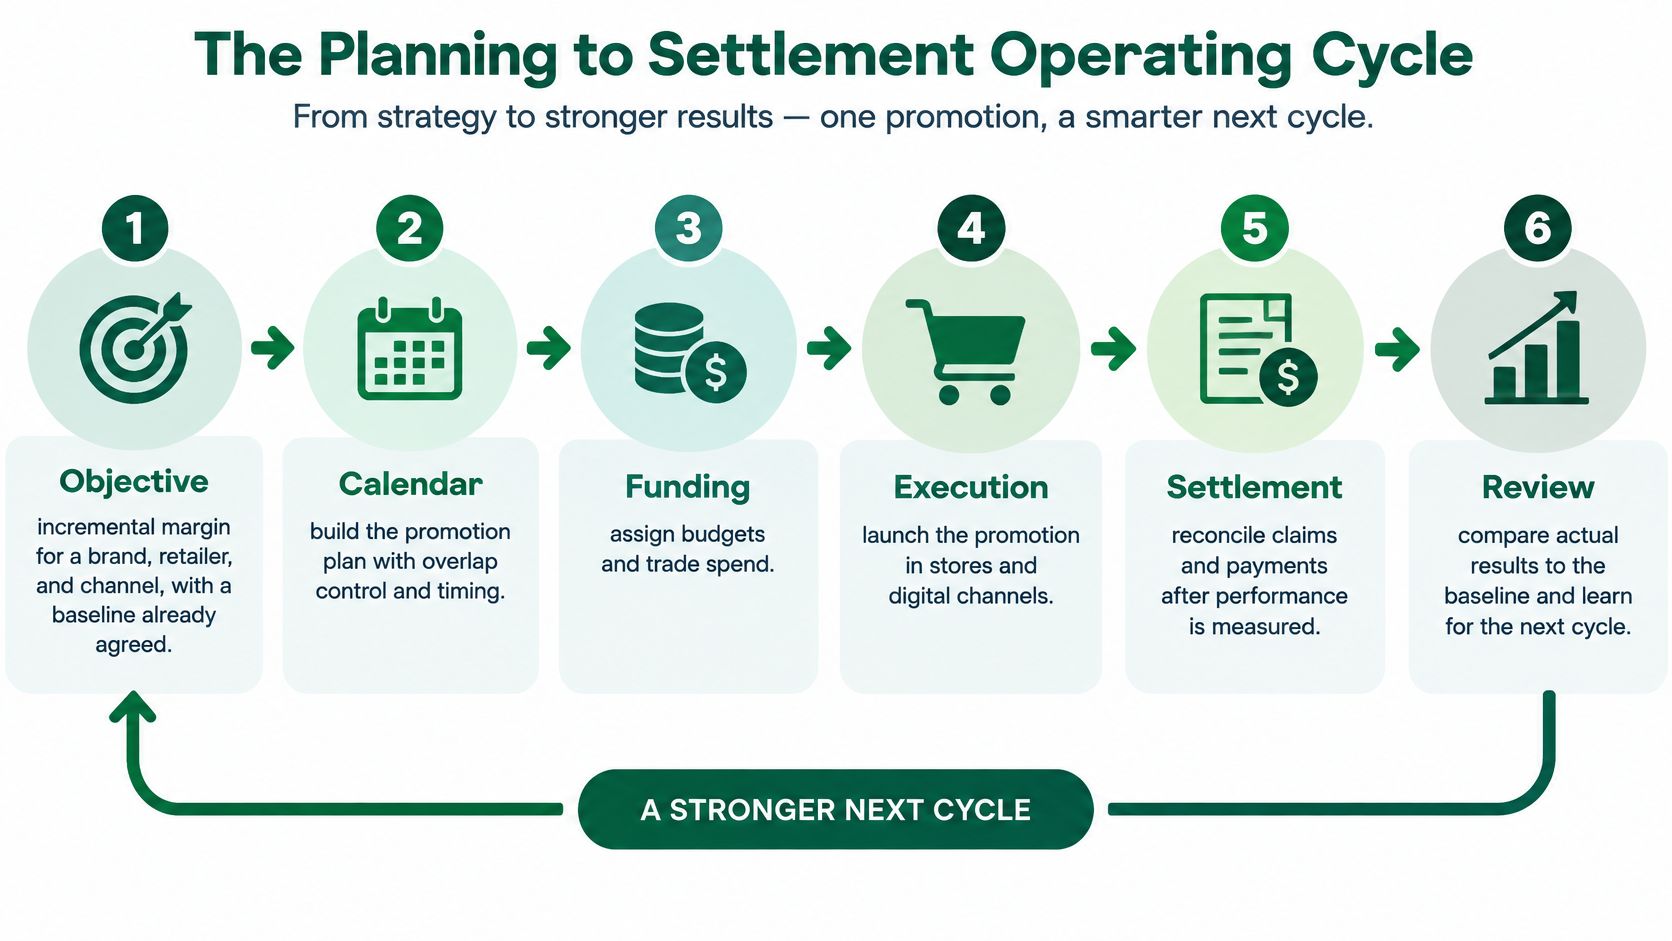
Set the objective. Specify incremental margin for the brand, retailer, and channel, with an agreed baseline. Assign baseline forecast accuracy to the planning owner.
Build the calendar with overlap constraints. Evidence summarized alongside the multichannel promotion study reports other grocery products declining by approximately 30% of the promoted product's uplift, so 10,000 apparent additional units can conceal roughly 3,000 displaced units; the multichannel study estimated displacement associations of 11.23% from physical to online and 19.34% from online to physical, with coordinated promotions reducing modeled channel cannibalization by 30.04%. Treat those as study findings, not universal planning coefficients, and track unresolved event overlaps.
Price the tactic and approve funding. Record depth, eligible units, fixed commitments, and the margin floor. CSNews's account of Nielsen analysis defines deep discounts as more than 25% below everyday or base price and reports that heavier deep-discount mixes degraded average category ROI. Track exceptions to the approved pricing guardrails.
Check supply and inventory. Phase expected orders separately from shopper consumption, then examine inventory before and after the event. Use forecast revisions and supply exceptions as operational checks; AI for demand forecasting should be evaluated against that workflow rather than a single aggregate accuracy score.
Execute and record evidence. Capture actual price, display placement, availability, and dates. Assign plan-versus-actual compliance to the execution owner, including documented deviations.
Settle claims against the agreement. Match eligible products, dates, quantities, and payment terms. Finance owns deduction cycle time and accrual-to-claim variance, with exceptions routed to the account owner.
Review and change the next plan. Close the post-event profit assessment and record whether to repeat, redesign, or stop the tactic. Track the share of reviewed events with positive incremental margin.
Give each handoff a measurable owner
Stage KPIs in the planning-to-settlement cycle
| Stage | KPI |
|---|---|
| Calendar and pricing | Baseline forecast accuracy against the approved planning tolerance |
| Execution | Plan-versus-actual execution compliance against agreed store requirements |
| Settlement | Deduction cycle time against the finance service standard |
| Settlement | Accrual-to-claim variance with documented reasons for exceptions |
| Post-event review | Share of events with positive incremental margin |
Use the operating-cycle walkthrough to frame a cross-functional review:
Before approving next month's event, check for a signed objective, overlap review, funded terms, supply confirmation, execution evidence plan, claims owner, and review date. An empty field should trigger an explicit exception, not an assumption that another function has handled it.
How TPM Systems Connect Data and Decisions
A TPM architecture needs linked records and controlled handoffs, not a screen that collects totals from disconnected systems. Start with an event identifier that survives changes to the offer and remains attached to shipments, claims, and adjustments.
The master record should contain SKU or GTIN, retailer, base price, discount depth, tactic, dates, fixed fees, and display terms. Preserve approved versions so a late commercial amendment does not overwrite the agreement used to validate an earlier claim.
Build upward from an auditable record
Connect ERP orders and shipments, retailer portals or deduction files, retailer or syndicated point-of-sale data, demand planning, and the general ledger. Reconcile product identifiers, units of measure, and customer hierarchies before calculating event economics.
A data integration platform can support those connections, but the design still needs named owners for unmatched records and late feeds. For external price observations, pricing data pipelines from WebscrapingHQ offer a relevant resource; keep observed shelf prices distinct from contracted prices and internally approved assumptions.
The architecture should make that separation visible:
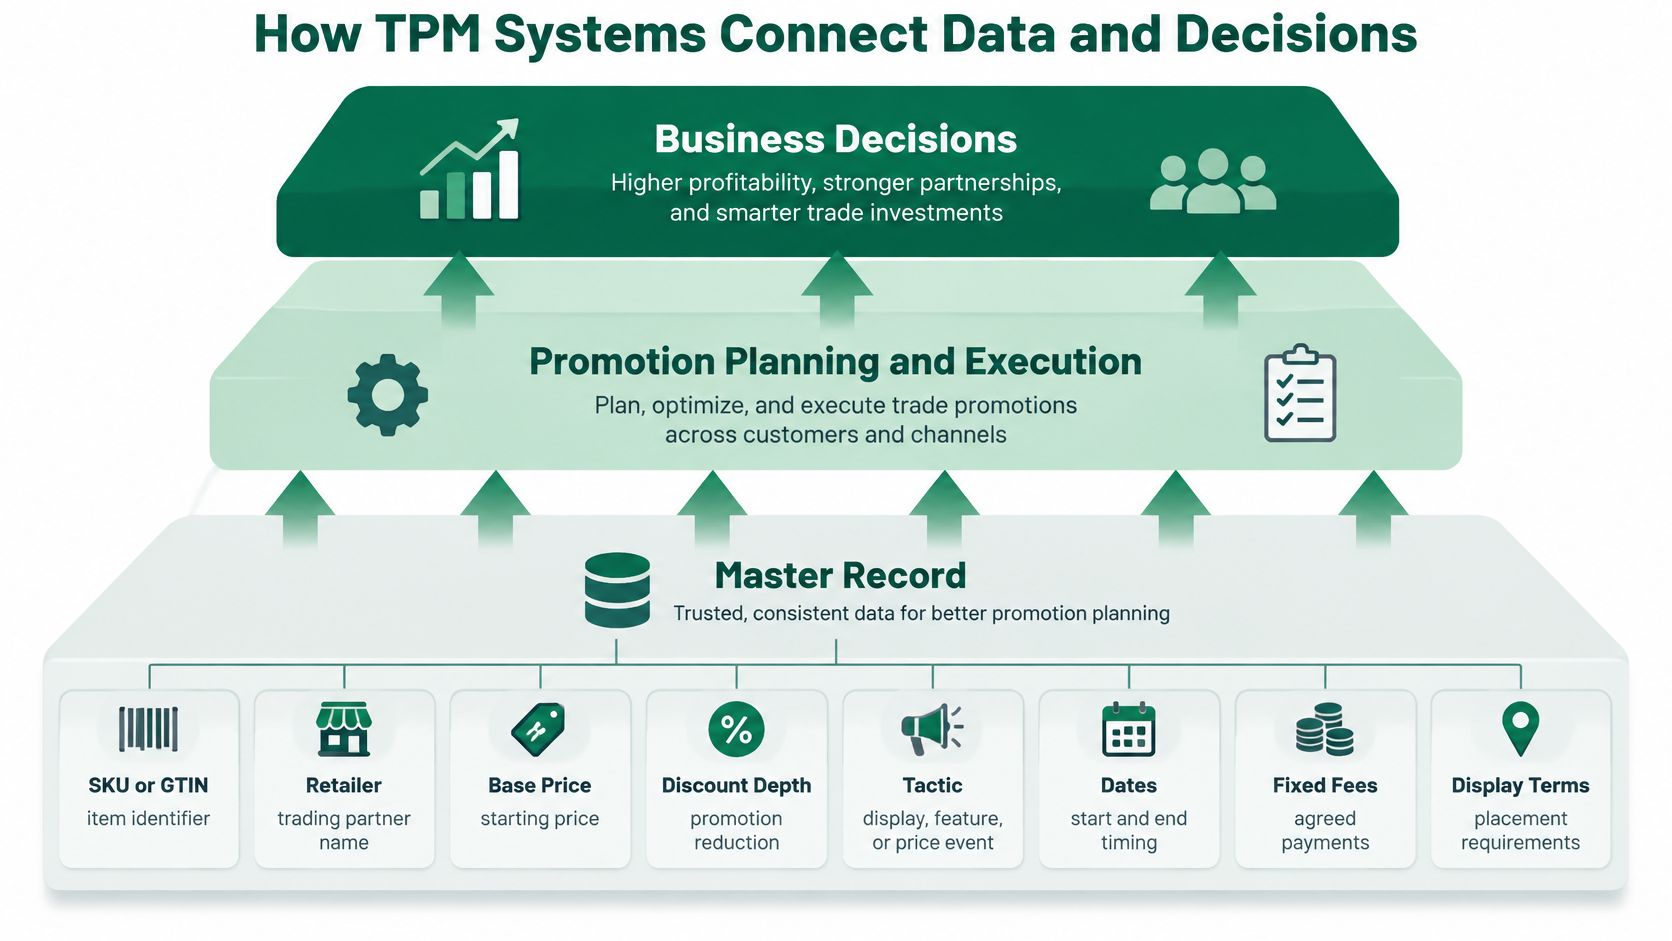
Place baseline models, account-level pass-through analysis, and depth-and-overlap scenarios above the reconciled data. Automate repeatable controls such as spend approvals, accrual estimation, duplicate-claim checks, and deduction matching. Keep disputed claims and unsupported model recommendations in an exception queue.
Treat accounting as a design constraint
Under IFRS 15, retailer payments generally reduce revenue as consideration payable to a customer unless the retailer provides a distinct service at fair value; TaxBakers' trade-promotion accounting guide explains that manufacturers estimate variable consideration when related goods are sold because claims may arrive weeks or months later, then reconcile estimates when deductions arrive.
That means the system needs an estimated liability before it has a final claim. Store the estimation basis, subsequent revisions, matched deductions, and residual balance separately. Don't release an accrual merely because the promotion ended; assess the remaining obligation.
Execution also needs its own actuals record: a Promotion Optimization Institute survey reported in 2025 found 61% of CPG manufacturers had difficulty executing promotions as planned, based on responses from more than 130 manufacturers.
For smaller suppliers, a clean file drop is an input, not a system of record. Map current tools to these layers:
- Master data: Event terms, identifiers, ownership, and versions.
- Integration: Source feeds, reconciliation, and exceptions.
- Decision support: Forecasts, scenarios, and evidence-qualified evaluations.
- Control: Approvals, liabilities, claims, and audit history.
A Practical TPM Implementation Roadmap
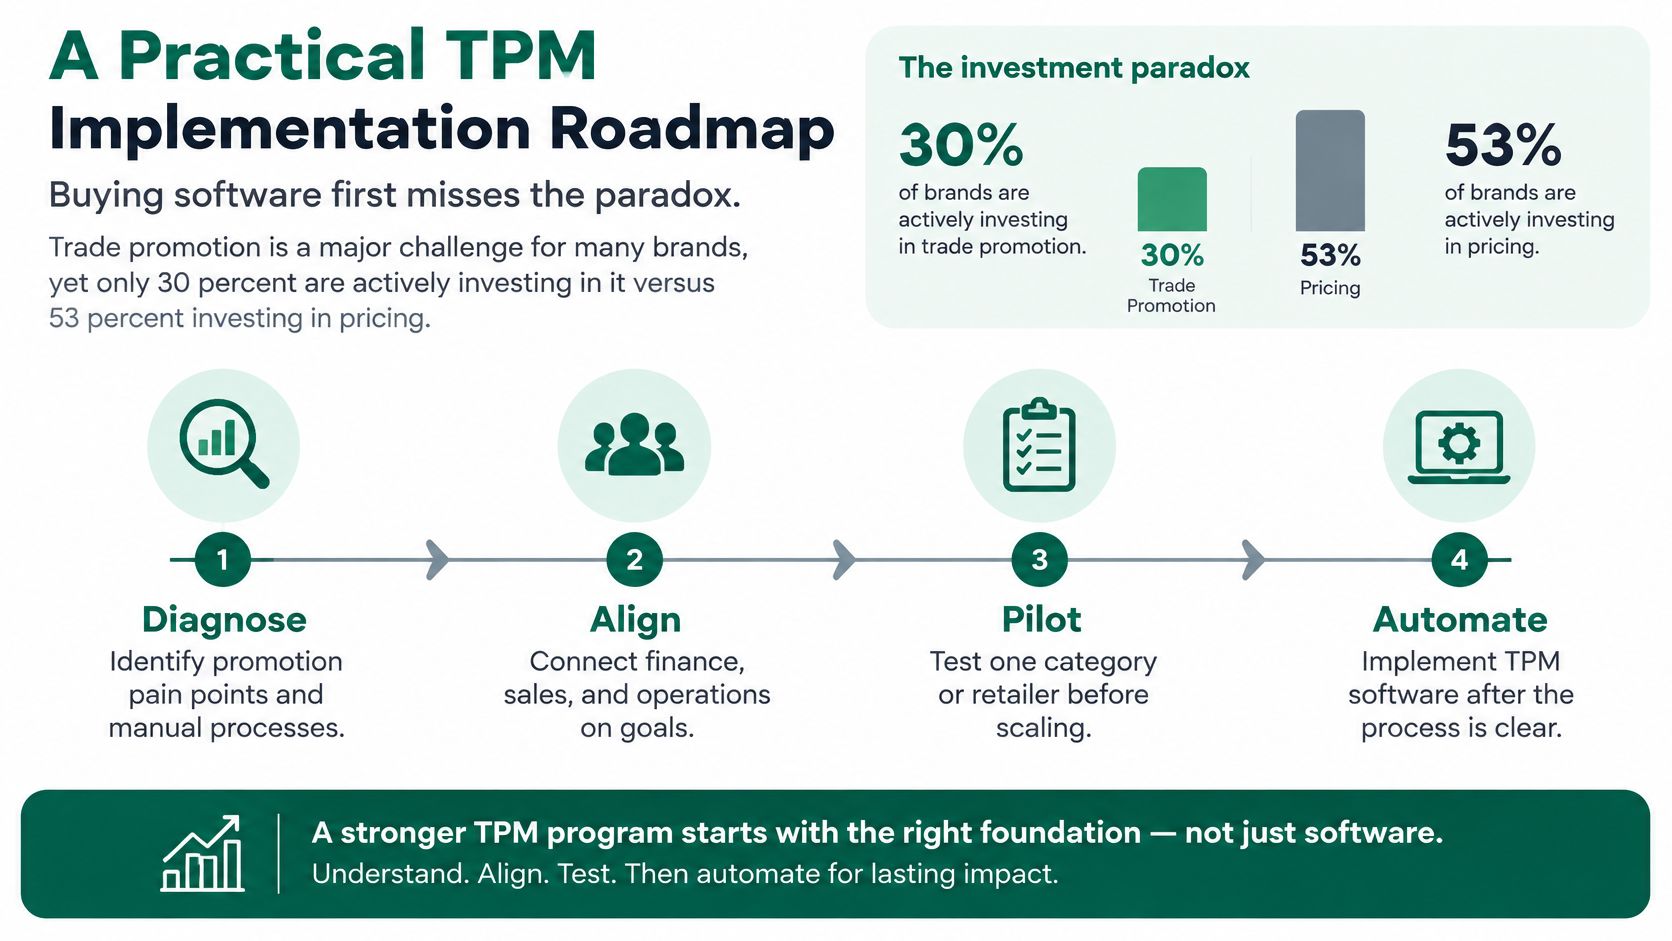
Trade promotion has an investment problem as well as a measurement problem. Vividly's revenue-growth-management white paper assigns it a 23% major-challenge rating, yet only 30% of brands are actively investing in it, compared with 53% investing in pricing.
Buying software first doesn't resolve divided ownership. Sales can continue approving commitments that finance interprets differently, while analysts spend their time reconstructing the event instead of evaluating it.
Use a process-first rollout:
Establish control before scaling
Agree the definitions and decision rights. Sales, finance, category management, and supply chain should sign off on baseline, incremental volume, net trade spend, and profit. Assign approval thresholds and a post-event owner.
Assemble a trustworthy event file. Choose a narrowly bounded category and retailer. Include the commercial agreement, execution evidence, source sales records, claims history, and remaining accruals; investigate mismatches before adding more events.
Pilot the measurement design. Schedule pre-event, live-event, and post-event observation before launch. Publish incremental margin with an evidence grade, and distinguish a measured outcome from a modeled scenario.
Close the financial loop. Reconcile deductions to commitments and explain the difference between estimated and claimed funding. Sales and finance should sign off on the same event result, including unresolved items.
Scale only the controls that work. Add scenario comparisons, overlap constraints, and automated matching after the pilot demonstrates that records reconcile and exceptions reach accountable owners.
Fund use cases with explicit acceptance tests
Prioritize changes that alter a repeatable decision, rather than adding an analytics feature because it's available.
- Redesign persistent losers: Measure whether redesigned events earn positive incremental margin after the full observation window.
- Improve settlement control: Measure accrual-to-claim variance and deduction cycle time, keeping disputed and undisputed claims separate.
- Improve calendar quality: Measure the share of events with positive incremental margin while monitoring forecast error against an agreed category tolerance.
An algorithm won't invent incrementality from missing store data. Better automation can make an unsupported conclusion arrive faster.
A smaller supplier or emerging-market distributor can start in a controlled spreadsheet. Use locked definitions, versioned assumptions, source-file references, approval records, and a scheduled review; don't mistake spreadsheet flexibility for permission to change the baseline after seeing the result.
Set the initial pilot scope as a single category, a single retailer, and a shared profit definition. Close that bounded commercial and financial cycle before expanding the deployment.
Judge TPM Vendors by Evidence
A vendor earns consideration when it can connect an approved promotion to execution, claims, and incremental profit. Score each system against decisions your team needs to make, not the polish of its demonstration. Ask vendors to process a pilot category with an amended agreement, an execution failure, a delayed claim, and an event whose apparent success changes after portfolio adjustments.
TPM vendor criteria and red flags
| Criterion | What good looks like | Red flag |
|---|---|---|
| Incrementality | Baseline, cannibalization, post-period, and net margin as separate fields | ROI calculated on gross lift |
| Accruals | Estimated variable consideration and claim matching | Spend dumped to expense at year-end |
| Execution | Planned versus actual price, display, and dates | A calendar with no store check |
| Integration | ERP orders, deductions, and POS or retailer portals | Manual files as the system of record |
| Scenarios | Depth, tactic, and overlap constraints | A single forecast number |
| Evidence | Customer results a buyer can audit | Dashboard screenshots only |
Require a reproducible result
Finance should trace the proposed event result to source transactions and remaining liability. The account owner should identify what changed between the approved offer and actual execution. Reject a proof that depends on analysts repairing results outside the demonstrated workflow.
Software cannot set an agreed baseline, assign an accountable post-event owner, or provide finance sign-off on a revenue deduction. Those controls must exist alongside the system. If store-level execution data are poor, optimization claims cannot be tested reliably.
For an automation evidence check, Applied tracks real AI use cases, tools, vendors, and adoption signals, supported by source-backed evidence and weekly research. Its library contains more than 500 verified cases across industries, including operations, marketing, engineering, and finance, organized in Use Cases, Models, Tools, Adoption Signals, Industries, and Reports. Use these documented workflows to assess an analytics add-on, not as proof that it improves TPM results.
Create a free account at Applied to access AI use cases and tools by industry, business function, and outcome, and compare measurable workflow results before funding a TPM analytics add-on. If your team needs help establishing governance, contact Applied about AI strategy, education, and hands-on implementation.