Measures of Value for AI: Metrics That Prove Real ROI
Define measures of value for AI initiatives, compare financial and non-financial metrics, and map them to each business function.
November 1, 2026

Your team just reported a busy quarter. The assistant handled thousands of requests, users ran more prompts, and the dashboard is full of green arrows. Then finance asks one plain question: what changed in cost, revenue, or risk? The room goes quiet because nobody agreed in advance which number would prove worth, who owned it, or what baseline you'd compare against. That's the gap most AI budgets die in, and it's fixable before the next review if you treat measurement as a decision system, not a reporting exercise.
Table of Contents
- What Measures of Value Mean for AI Initiatives
- Financial and Non-Financial Measures Side by Side
- Building the Five-Layer Chain from Model to Ledger
- Selecting Metrics with a Four-Question Framework
- Metrics Mapped to Operations, Engineering, Marketing and Service
- Set Up Value Measurement and Pass the Budget Gate
- Pitfalls That Quietly Erase Measured Value
What Measures of Value Mean for AI Initiatives
A team reports that its assistant handled 40,000 requests last quarter. Finance asks what changed in cost, revenue, or risk. The count cannot answer. It is a real activity measure, but without a baseline or a decision tied to it, it says little about whether the system created worth.
In economics, measures of value provide a common unit for comparing amounts over time. The U.S. Bureau of Labor Statistics CPI history describes the consumer price index as measuring the average change over time in prices paid by urban consumers for a representative basket of goods and services. A dollar in 1913 and a dollar decades later have the same face value, but not the same purchasing power. Comparing them requires an adjustment.
For enterprise AI, a measure of value is the agreed yardstick for deciding whether a system created worth. Requests handled, tokens processed, and prompts run describe activity. More useful measures include cost per resolved case, revenue influenced, hours redeployed, or risk avoided. Each still needs a clear baseline and a connection to a budget decision. Hours saved, for example, do not become cash savings unless capacity is redeployed or spending changes. A successful pilot may also fail to justify production costs, while risk can disappear from the calculation if teams leave it unmeasured.
Customer service faces the same distinction: reply volume means little until connected to retention or cost to serve. Whether teams seek to prove the value of social care or assess an AI system, start with one question: which decision will this number change?
Financial and Non-Financial Measures Side by Side
Financial measures answer whether money came in or was kept. Non-financial measures show whether the system is moving toward that result, often weeks or months earlier. You need both, but you lead with different ones depending on who's in the room.
Financial and Non-Financial AI Value Measures
| Measure | What it counts | Best used for | Main weakness |
|---|---|---|---|
| Revenue uplift | Added revenue from AI-assisted sales, upsell or retention | Investment cases and board reporting | Hard to attribute without a control group |
| Cost-to-serve reduction | Cost per case, ticket or transaction before and after | Operations budget decisions | Ignores quality changes unless paired with error rates |
| Margin expansion | Gross margin change on the affected product line | Long-term pricing and portfolio decisions | Slow to appear; many outside drivers |
| Avoided labor and infrastructure spend | Contractor, overtime or hosting costs that were not incurred | Headcount and vendor planning | Counts only if the spend is actually removed from the budget |
| Net value after run costs | Gross benefit minus usage, licensing, integration and monitoring costs | Go or stop decisions | Depends on honest cost capture |
| Cycle time | Hours or days from request to completed output | Process owners and operations leaders | Speed alone can hide quality loss |
| Adoption rate | Share of target users active each week | Early signal that value can appear | Usage is not an outcome |
| Severe error rate | Share of outputs causing material harm or rework | Risk and compliance reviews | Rare events need larger samples to measure |
| Customer satisfaction | Survey score or repeat-contact rate | Service and retention teams | Lagging and noisy in short windows |
Revenue uplift and net value after run costs carry the budget conversation, but they're the hardest to attribute cleanly. Cost-to-serve reduction is usually where operations leaders should start because cost per case has a clear owner and a clear before and after. Margin expansion matters for portfolio decisions, yet it arrives late and picks up noise from pricing, mix, and demand. Avoided spend is the row I interrogate hardest. If the contractor budget, overtime line, or hosting contract didn't shrink, you haven't saved anything. You've described a possibility.
Which Family Leads
Lead with financial measures when the audience is a budget committee. Lead with non-financial measures during the first 90 days, when money hasn't arrived yet and you need early evidence that adoption, cycle time, and error rates are moving the right way. Never send non-financial measures to finance alone, and never let a financial figure stand without the operating evidence behind it. A practical way to build that discipline is to run your assumptions through an AI ROI calculator and force every benefit line to name its operating driver.
Practical rule: A metric changes families when you convert it. Cycle time is non-financial until you turn it into cost per case, at which point it becomes a financial measure with an owner who can be held to it.
Marketing teams learned this lesson earlier. The POAS vs ROAS breakdown shows why a revenue-based ratio can flatter performance while a profit-based ratio tells you what you kept. AI reporting has the same trap.
Building the Five-Layer Chain from Model to Ledger
Think of value measurement as a relay race. Five runners pass the baton, and a dropped handoff at any leg means the finish time says nothing about the team's real speed. McKinsey's guidance on measuring AI value sets out a five-layer chain of technical quality, user adoption, operational change, financial impact, and total cost of ownership. Each layer has to hand credible evidence to the next.
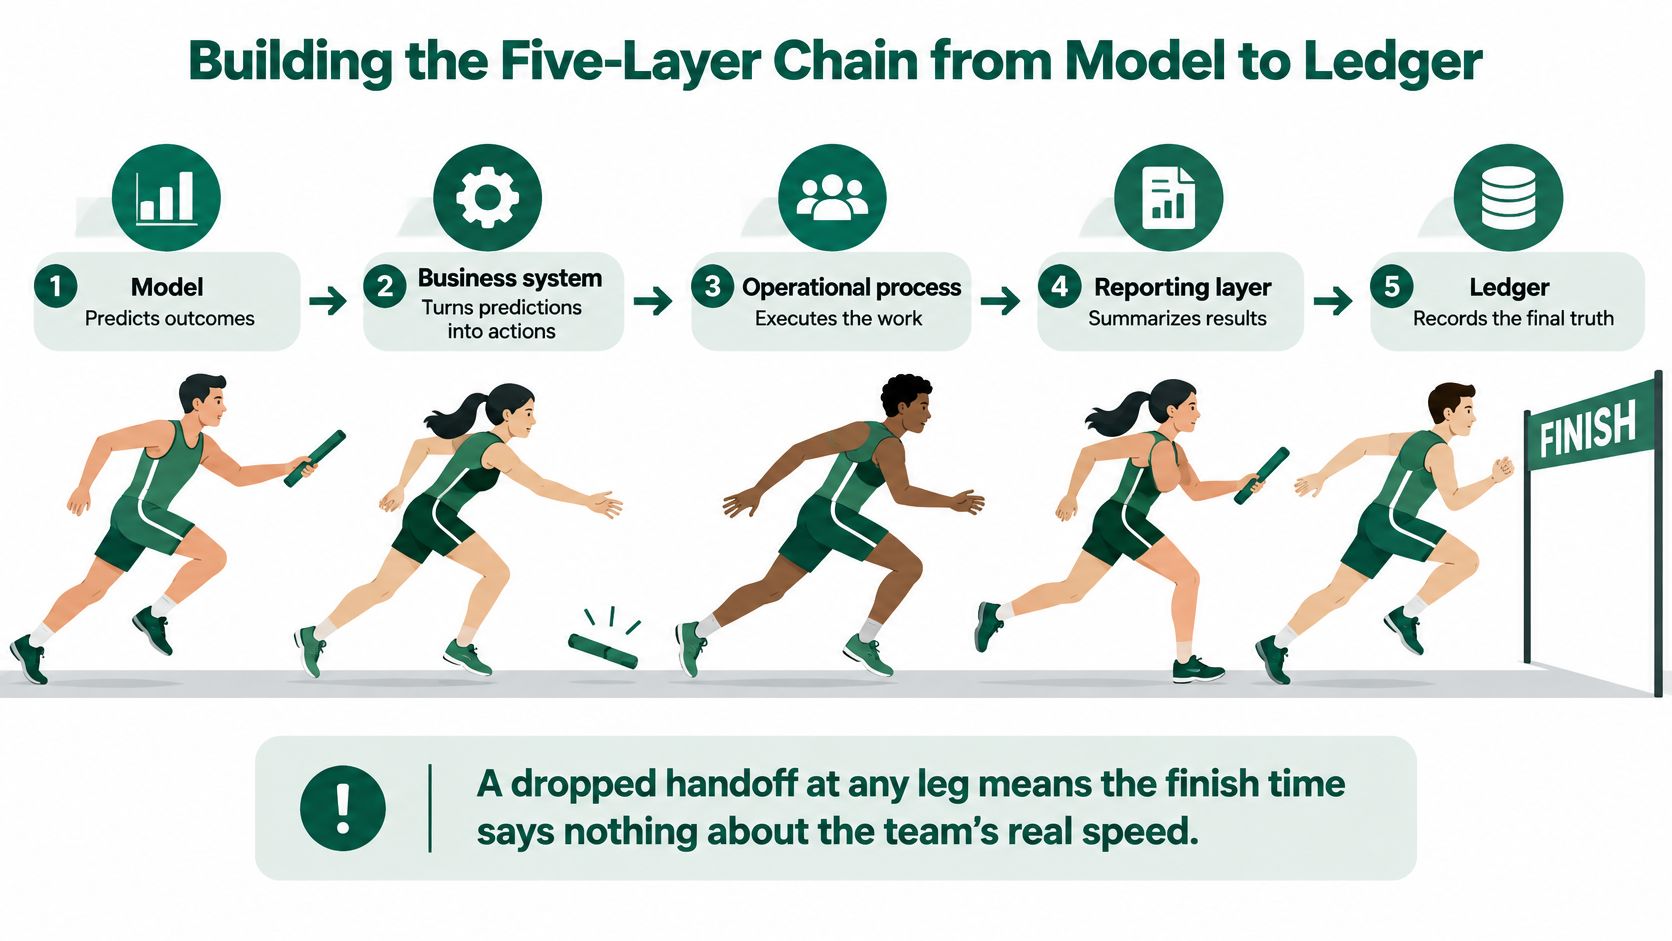
The Five Handoffs
- Technical quality: Track precision, recall, latency, uptime, and hallucination or error rates. This tells you the model works under test conditions. It tells you nothing about money.
- User adoption: Track active-user frequency and task coverage. If the intended users don't show up weekly, every downstream layer is theoretical.
- Operational change: Track cycle time, defect or rework rates, abandonment, first-contact resolution, and cost per case or transaction. At this stage a working model either changes the work or doesn't.
- Financial impact: Count revenue uplift, cost-to-serve reduction, margin expansion, and avoided labor or infrastructure expense. Each figure should trace back to an operational change you can point to.
- Total cost of ownership: Subtract model usage, cloud, licensing, integration, monitoring, and change-management costs. Skip this layer and you're reporting gross benefit dressed up as return.
Say a model scores 95% accuracy in evaluation but only 20% of target users adopt it. Layer one looks excellent. Layer four will still show zero because the baton never got past the second runner. That's why I'd rather see a team's AI model evaluation results reported next to adoption and task coverage than on their own slide. Accuracy is a gate, not a result.
The Baseline Rule
Compare outcomes against a credible baseline. Use a randomized control group where you can, a phased rollout where you can't, or a matched historical cohort as a last resort. Adjust for volume, seasonality, staffing, and process changes while you're at it. Otherwise a quiet month gets credited to automation, and you'll scale a system whose apparent gains were really a drop in demand.
Put benefits and costs on the same sheet, and report realized value on a separate line from forecast value. Mixing the two is how a projection becomes a promise nobody approved.
That ledger discipline is what separates measures of value that survive a budget review from ones that collapse under one question. When each layer is measured and the handoffs are visible, you can see exactly where a technical gain stopped becoming an economic one, and you can fix that leg instead of arguing about the finish time.
Selecting Metrics with a Four-Question Framework
Many teams can track dozens of numbers. However, most of those numbers do not influence decisions. I evaluate every candidate metric with four questions before it earns a place on the scorecard.
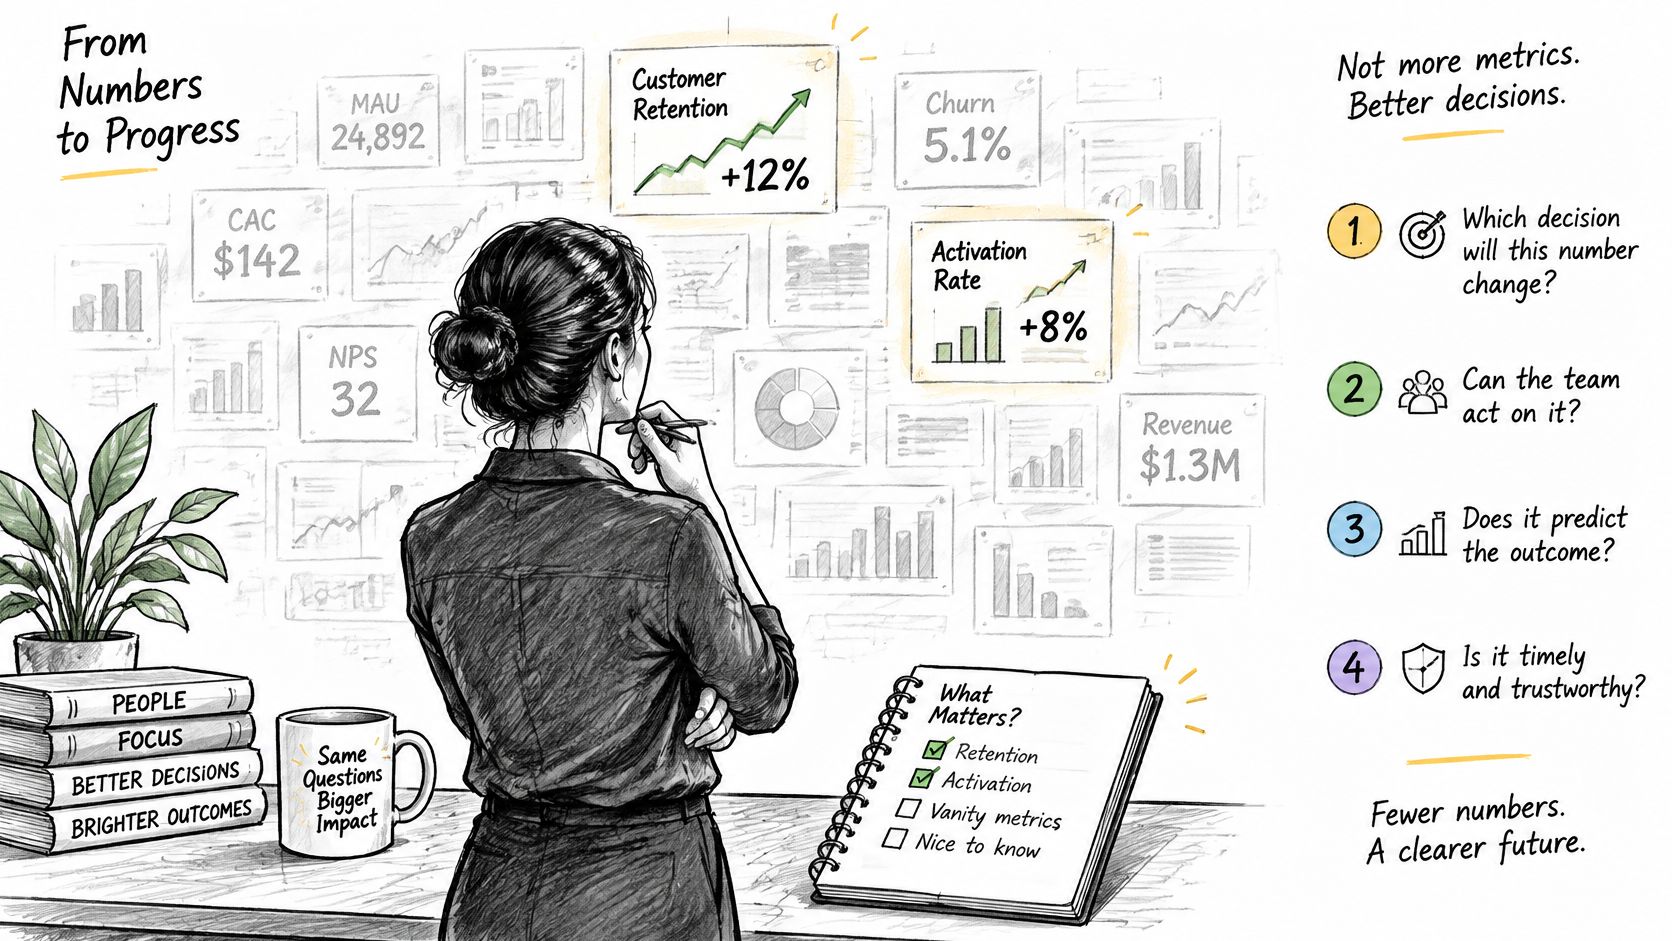
- Which decision will this change? Name it concretely. Budget, scale, stop, or redesign. If nobody can say what they'd do differently at a given threshold, drop the metric.
- Can it move within 90 days? If not, name the leading metric that signals it's coming. Margin moves slowly, but cycle time and adoption move fast enough to steer by.
- Who owns the number? The owner needs the authority to influence it. A metric owned by a committee is owned by no one when it turns red.
- What's the downside if it's gamed or the system fails? Every speed metric invites corner cutting. Pair it with the error or complaint measure that exposes the trade.
Coverage Across Outcomes
Selection also needs breadth. A McKinsey survey of 701 executives and senior leaders across North America, Europe, Asia-Pacific, Latin America, the Middle East, and Africa measured enterprise AI value across four outcome dimensions, namely bottom-line performance, cost savings, employee experience, and customer outcomes. In that survey, nearly 48% of leaders in the most advanced reinvention group reported capturing meaningful enterprise value, compared with 13% in the enablement group and 24% in the automation group. Pick at least one measure from each dimension your business needs. You don't need all four for a narrow internal tool, but you do need to say why you left one out.
For the fourth question, use the risk check in NIST's Generative AI Profile, which defines AI risk as a composite measure of an adverse event's likelihood and the magnitude of its consequences. Score each serious failure mode on that pair, select measurement approaches for the most significant risks first, and reassess regularly whether the metrics and controls still fit. A claims team, for example, would score its severe error rate by how often a bad decision occurs and what one costs to unwind, before approving any scale-up.
A Simple Scoring Pass
Rate each candidate from 1 to 3 on decision fit, time to signal, ownership, and risk coverage, then keep the top five to seven. Say a claims team keeps cycle time, net cost per claim, error rate, adoption, and complaint rate, and drops tokens used because nobody makes a decision based on it. That's the right call. Tokens belong in the cost ledger, not on the value scorecard.
Metrics Mapped to Operations, Engineering, Marketing and Service
Each function has a primary metric that matches its daily work. Forcing one corporate template onto every team produces numbers nobody recognizes as their own. Start with operations, because that's where most value claims begin and where the most common confusion lives.
Primary Value Metrics by Business Function
| Function | Primary value metric | What the result does not prove |
|---|---|---|
| Operations | Hours saved per month across workflows | Hours saved are not cash saved until headcount, overtime or vendor spend changes |
| Software engineering | Lead time for a migration | One migration does not prove steady-state delivery speed |
| Security and incident response | Mean time to resolution | Vendor-reported; needs a baseline period and a fixed incident mix |
| Marketing | Additional qualified leads per month | Lead volume needs conversion-to-revenue tracking |
| Customer service | Issues resolved per hour | The average hides variation across agent skill levels |
Operations teams usually open with hours saved per month. It's a legitimate capacity signal and a poor financial claim. Until headcount, overtime, or vendor spend changes, or the freed hours visibly produce more throughput, those hours are potential energy. Report them, but label them correctly and track where the time went.
Engineering leaders often point to lead time for a migration. A single migration finished faster shows the tool helped on that job. It doesn't prove steady-state delivery speed, because migrations are unusually well suited to AI assistance and unusually well staffed. Demand a second and third project of ordinary work before you generalize. Security teams lean on mean time to resolution, which is only meaningful against a baseline period with a fixed incident mix. A quarter with fewer severe incidents will flatter any tool.
Marketing's additional qualified leads per month has the same attribution problem in a different costume. Lead volume means little until you track conversion to revenue, because a looser qualification bar manufactures leads on demand. Pair the count with downstream pipeline and close rates, or you're rewarding the team for moving the definition.
Customer service gives you the cleanest published example of the productivity and cost distinction. Researchers publishing in the Quarterly Journal of Economics found that in 2025, generative-AI assistance increased customer-support productivity by 15% on average, measured as issues resolved per hour. That's a real productivity result. It isn't a cost result until staffing, scheduling, or vendor arrangements change, and the average hides wide variation across agent skill levels.
Guardrail habit: Give each function one primary metric and one guardrail metric. Service pairs issues resolved per hour with repeat contact. Engineering pairs delivery speed with defect rate. Speed without a guardrail is an invitation.
Before you set targets, compare your baseline against documented deployments with named outcomes. Browsing AI success stories with quantified results helps you sanity check whether your target sits inside what comparable teams have achieved, rather than what a vendor deck promises.
Set Up Value Measurement and Pass the Budget Gate
Most value problems start before launch, when no one records what normal looks like. By the time finance asks for the before picture, the team is reconstructing it from memory and screenshots. Five setup steps prevent that.
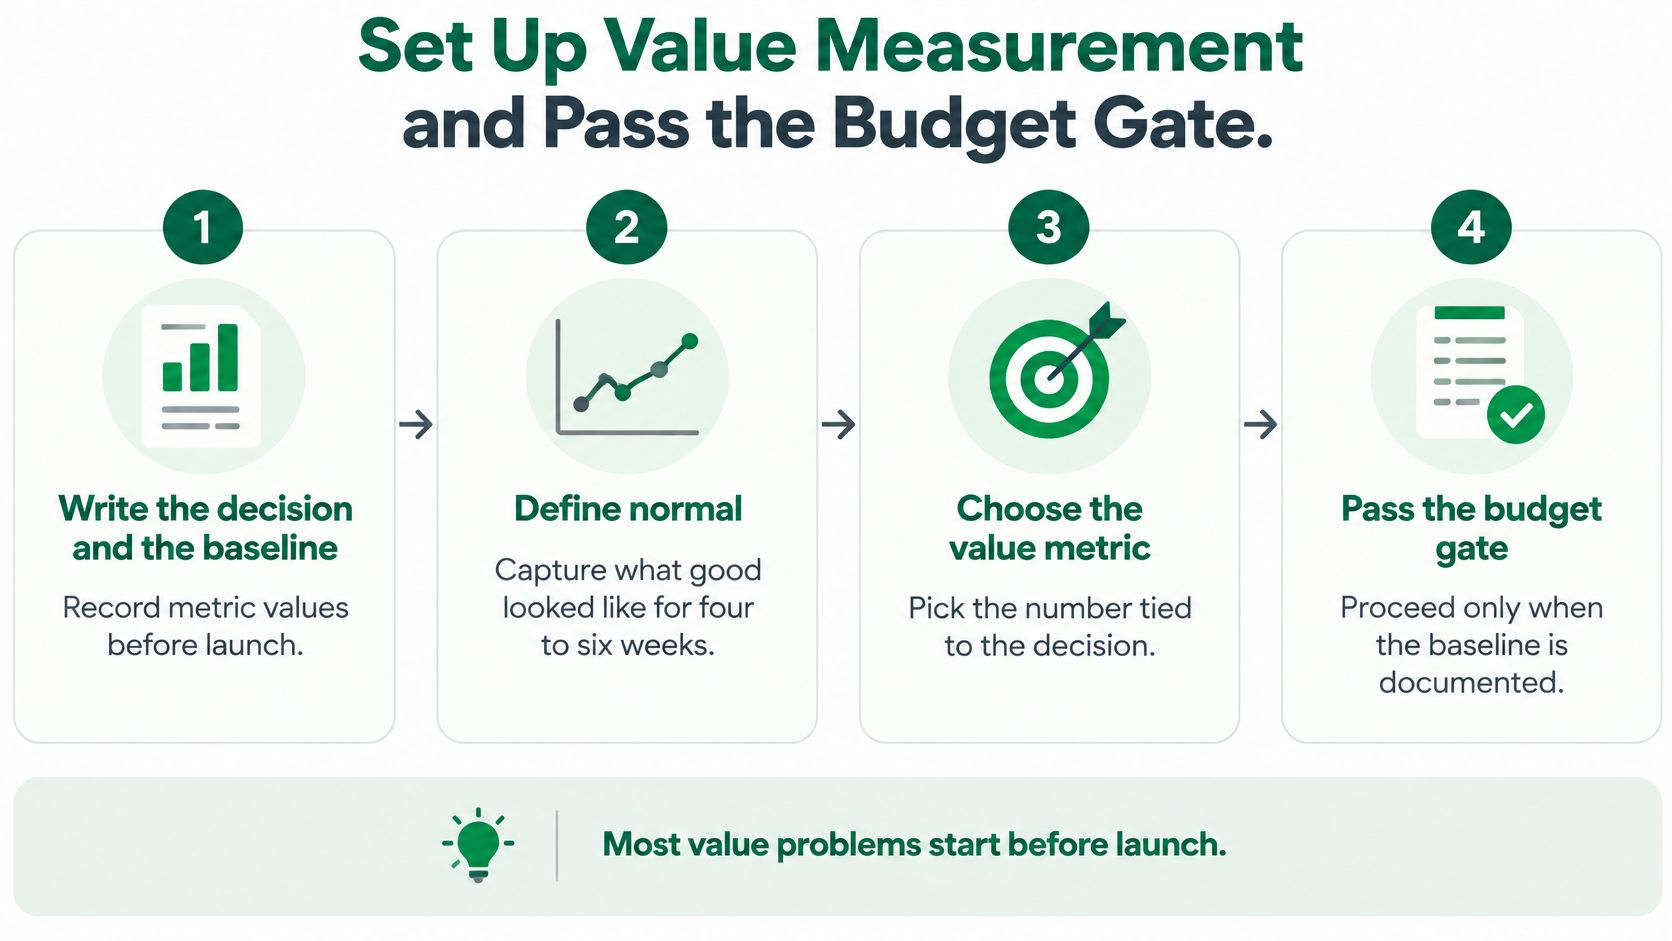
- Write the decision and the baseline. Record metric values for four to eight weeks before launch, with dates and the process described in enough detail that a newcomer could reproduce the measurement. The common mistake is redefining the baseline mid-test when the first results disappoint.
- Pick three to five KPIs. Take at least one measure from each layer you can observe. The mistake to avoid is choosing KPIs no one owns, which guarantees they'll be reported late and defended by no one.
- Set the control. Use a randomized holdout of roughly 10% of cases, a phased rollout by team, or a matched historical cohort. Without a control, every improvement in the business becomes evidence for your system.
- Set the review cadence at 30, 60, and 90 days. Report realized value and forecast value on separate lines, with run costs in the same ledger. Presenting forecast value as cash is the fastest way to lose credibility with finance permanently. Teams that run their reporting through software for auditable finance processes find this separation easier to maintain, because the audit trail forces each figure back to its source entry.
- Assign one owner and a written stop rule. Agree in advance that scale-up pauses if, say, the severe error rate passes the agreed threshold. A stop rule written after results arrive isn't a rule. It's a negotiation.
The Budget Gate
Before approving the next budget, check five things. Is the baseline written down? Is the control method named? Do gross and net value sit on the same sheet? Does every KPI have an owner and a stop rule? Is forecast value labeled and kept off the realized line? If any item is missing, approve a measurement phase rather than a scale-up. That's cheaper than funding a rollout you can't evaluate.
The evidence for this discipline is blunt. McKinsey's 2025 State of AI research found that more than 80% of respondents said their organisations were not yet seeing a tangible enterprise-level EBIT impact from generative AI, and it identified tracking well-defined key performance indicators for generative-AI solutions as the adoption and scaling practice most strongly associated with bottom-line impact. At larger organizations, a clearly defined adoption roadmap was also among the practices with the greatest effect.
To set baselines and targets against production reality instead of vendor claims, create an account at Applied and use the library of AI use cases, tools organised by industry and business function, and recorded outcomes to compare your metrics with deployments already running.
Pitfalls That Quietly Erase Measured Value
Technically successful pilots fail to produce enterprise value all the time. The model worked. The demo impressed people. Then production economics arrived, with integration queues, oversight duties, retraining, and incident handling that nobody included in the pilot's ROI. The economics were never tested under real conditions, so the pilot's numbers described a world that doesn't exist at scale.
The friction is well documented. Deloitte's 2025 survey of 1,854 executives across Europe and the Middle East found that fragmented systems and siloed platforms make before-and-after impact difficult to track, and one in four respondents cited inadequate infrastructure and data as a barrier to ROI. Deloitte also reports that AI returns can take several years because of implementation complexity, adoption, and process integration. KPMG's 2025 survey, cited alongside that work, found risk management was expected to be the greatest GenAI challenge for 82% of respondents, followed by data quality at 64%. If your value model assumes none of that friction, it isn't a model. It's a brochure.
Value Measurement Pitfalls, Causes and Fixes
| Symptom | Likely cause | Fix |
|---|---|---|
| Large time savings, flat budget | Saved hours become unallocated slack | Track redeployed capacity and throughput growth alongside hours saved |
| Strong pilot ROI, weak production results | Integration, oversight and run costs left out | Subtract all run costs from gross benefit to report net value |
| Productivity up, severe errors rising | Only speed was measured | Pair speed metrics with severe error rate by user group |
| Results fade after launch | Adoption was never tracked | Track weekly active users and task coverage from day one |
| Payback later than budget cycle | Delayed returns not modeled | Build a multi-year timeline and report realized and forecast value separately |
| Impact cannot be attributed | No baseline or control group | Use a holdout, phased rollout or matched historical cohort |
The first row is the one I see debated most. Time saved becomes slack when no one makes a redeployment decision. The fix isn't to stop counting hours. It's to track redeployed capacity and throughput growth beside them, so an AI-enabled hour has to show where it went. Did the team clear a backlog, absorb volume without hiring, or ship work that was previously impossible? If none of those happened, the hour evaporated and your measures of value should say so.
The second and fifth rows are really one problem, which is reporting gross benefit instead of net value. Net value means expected productivity or revenue gains minus integration costs, oversight, retraining, failure remediation, security, compliance, and opportunity cost. Run that subtraction, and some celebrated use cases go underwater, while quieter ones with modest headline gains, low friction, strong controllability, and rapid payback turn out to be the best investments in the portfolio. Delayed returns compound the issue. A use case that pays back in year three may be worth funding, but only if the timeline is modeled openly instead of compressed to fit this year's budget cycle.
The third row is the dangerous one. A system that cuts handling time while severe errors climb can destroy more value than it creates, especially in healthcare, finance, or safety-critical operations where one bad output costs more to unwind than hundreds of fast ones save. Pair every speed metric with a severe error rate by user group, because averages hide the segment where the system is failing. Rows four and six come back to basic hygiene. Track weekly active users and task coverage from day one so fading adoption shows up as a trend, not a surprise, and keep a holdout or phased rollout so attribution survives an argument.
A gain counts only when it survives the cost and risk ledger. Everything before that subtraction is a forecast wearing a result's clothes.
I'll leave you with the question I'd put to any steering committee. When should leaders stop scaling a promising use case because governance and process costs consume its apparent ROI? Teams that can answer that with a threshold they set in advance are measuring value. Teams that can't are measuring activity and hoping finance won't notice.
If your next budget review needs evidence instead of activity counts, create an account at Applied to explore the library of AI use cases, tools by industry and business function, and verified outcomes from deployments already in production. Use those baselines and results to set targets, choose guardrail metrics, and walk into the review with numbers that hold up.