Explainable AI Methods That Improve Decisions
Explore explainable AI methods, from SHAP and LIME to counterfactuals, with practical guidance on evaluation, selection, deployment, and real-world use.
October 22, 2026
You're reviewing a flagged transaction, a loan application, or a production alert. The model gives you a score. It doesn't tell you whether to approve it, investigate further, escalate it, or step back because the system shouldn't be deciding this case at all.
That's where explainable AI methods earn their place. They don't make a prediction more accurate by themselves. They help a specific person do a specific job, such as checking a decision, finding a failure, documenting a limitation, or explaining an outcome to someone affected by it.
If the explanation doesn't fit that job, a polished chart can still leave you stuck.
Table of Contents
- Why an Explanation Must Fit the Decision
- Understanding the Two Main Families
- Comparing Post-Hoc Explanation Techniques
- Exploring Global and Example-Based Explanations
- Why Better Explanations Can Still Lead to Worse Decisions
- Selecting and Testing Explainable AI Methods
- Matching Explanations to Real-World Decisions
- Build an Explanation Strategy That Survives Production
Why an Explanation Must Fit the Decision
An operations lead sees a supplier risk score jump overnight. A bar chart names three contributing features, but it doesn't show whether data is missing, whether this supplier resembles cases the model handled badly, or what action is safe now. The explanation looks complete. It still doesn't support the decision.
That gap is common. Teams often treat predictive accuracy, user trust, and explainability as if they're the same thing. They're not. A model can predict well and explain poorly. An explanation can also sound convincing while misrepresenting how the model reached its output.
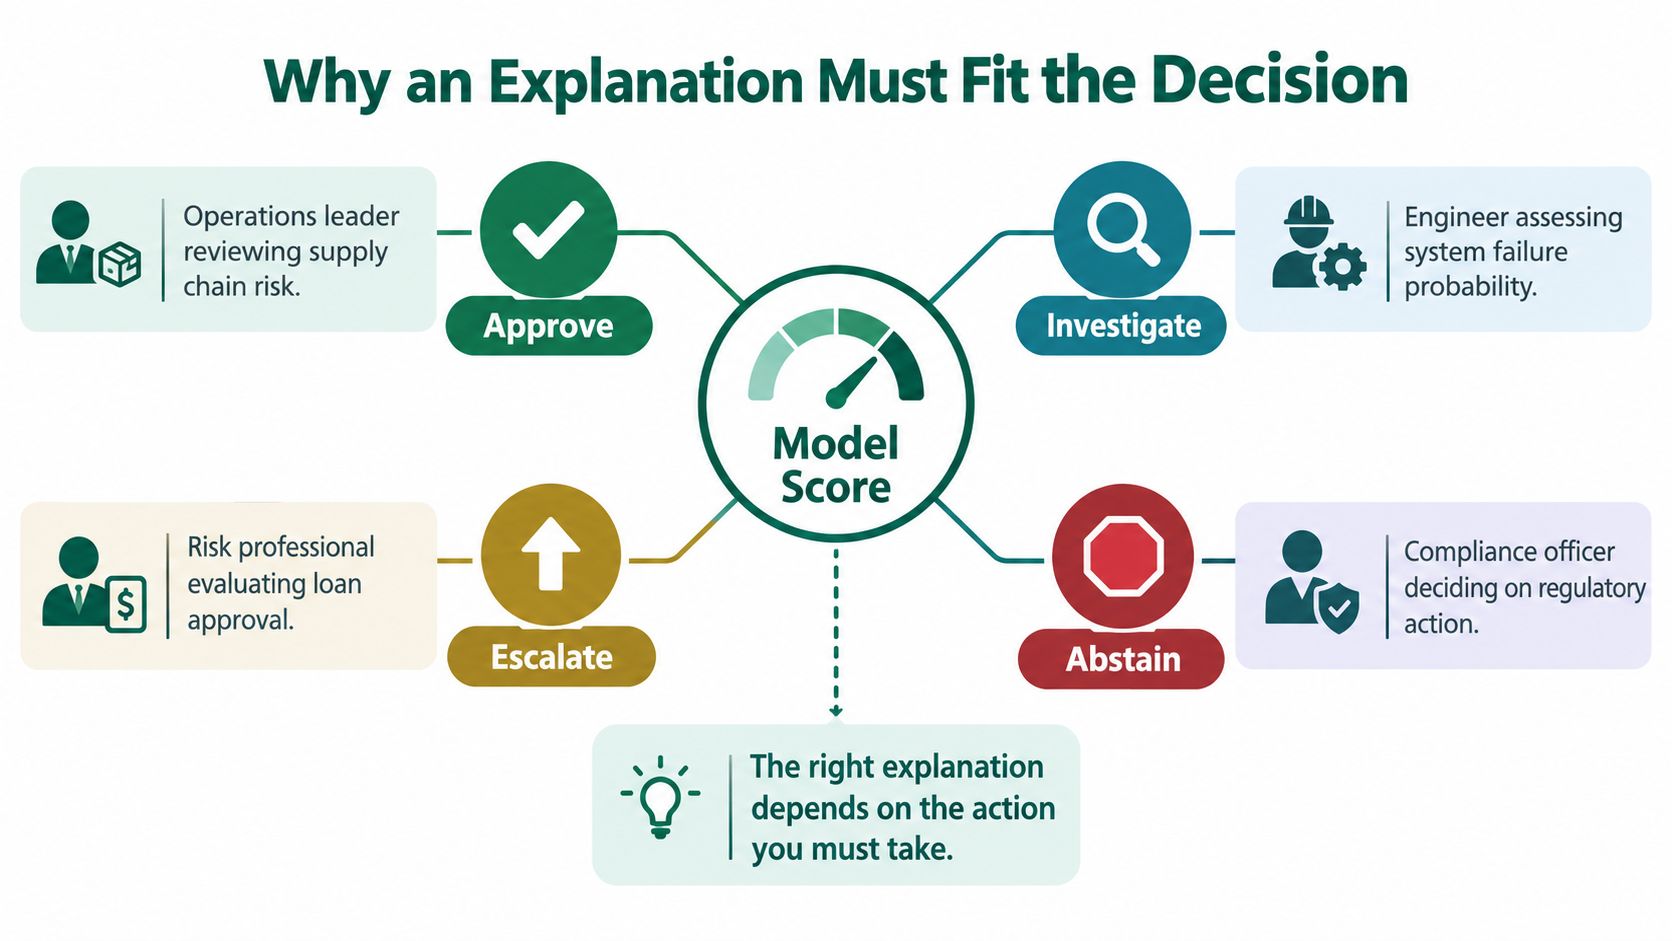
Four Different Explanation Jobs
A global explanation describes how a model behaves across many cases. A local explanation addresses one prediction. Example based evidence shows similar or contrasting cases. Transparency is broader still, covering disclosure, documentation, and provenance.
NIST frames this through principles that include providing evidence for outputs, making explanations meaningful to the intended user, ensuring the explanation accurately reflects the system's process, and recognizing knowledge limits, as set out in NIST's four principles for explainable AI. Under that fourth principle, a system without sufficient confidence shouldn't present a decision as if it's ready for use.
An explanation is useful only when the recipient can understand it, check it against the model's behavior, and act safely on it.
Simplicity doesn't solve this automatically. A short explanation may hide uncertainty. A high fidelity visualization may overwhelm the person who has minutes, not hours, to decide.
| Decision job | Useful evidence | Typical failure |
|---|---|---|
| Approve or reject | Main drivers, counterevidence, confidence | Only supportive reasons shown |
| Investigate | Similar cases, missing data, unusual inputs | Feature list with no context |
| Escalate | Risk, limits, policy triggers | No threshold for human review |
| Abstain | Low confidence, out of scope signals | Model answers anyway |
| Audit | Version, inputs, method, action taken | Explanation can't be reproduced |
Start with the action. Then choose the method.
Understanding the Two Main Families
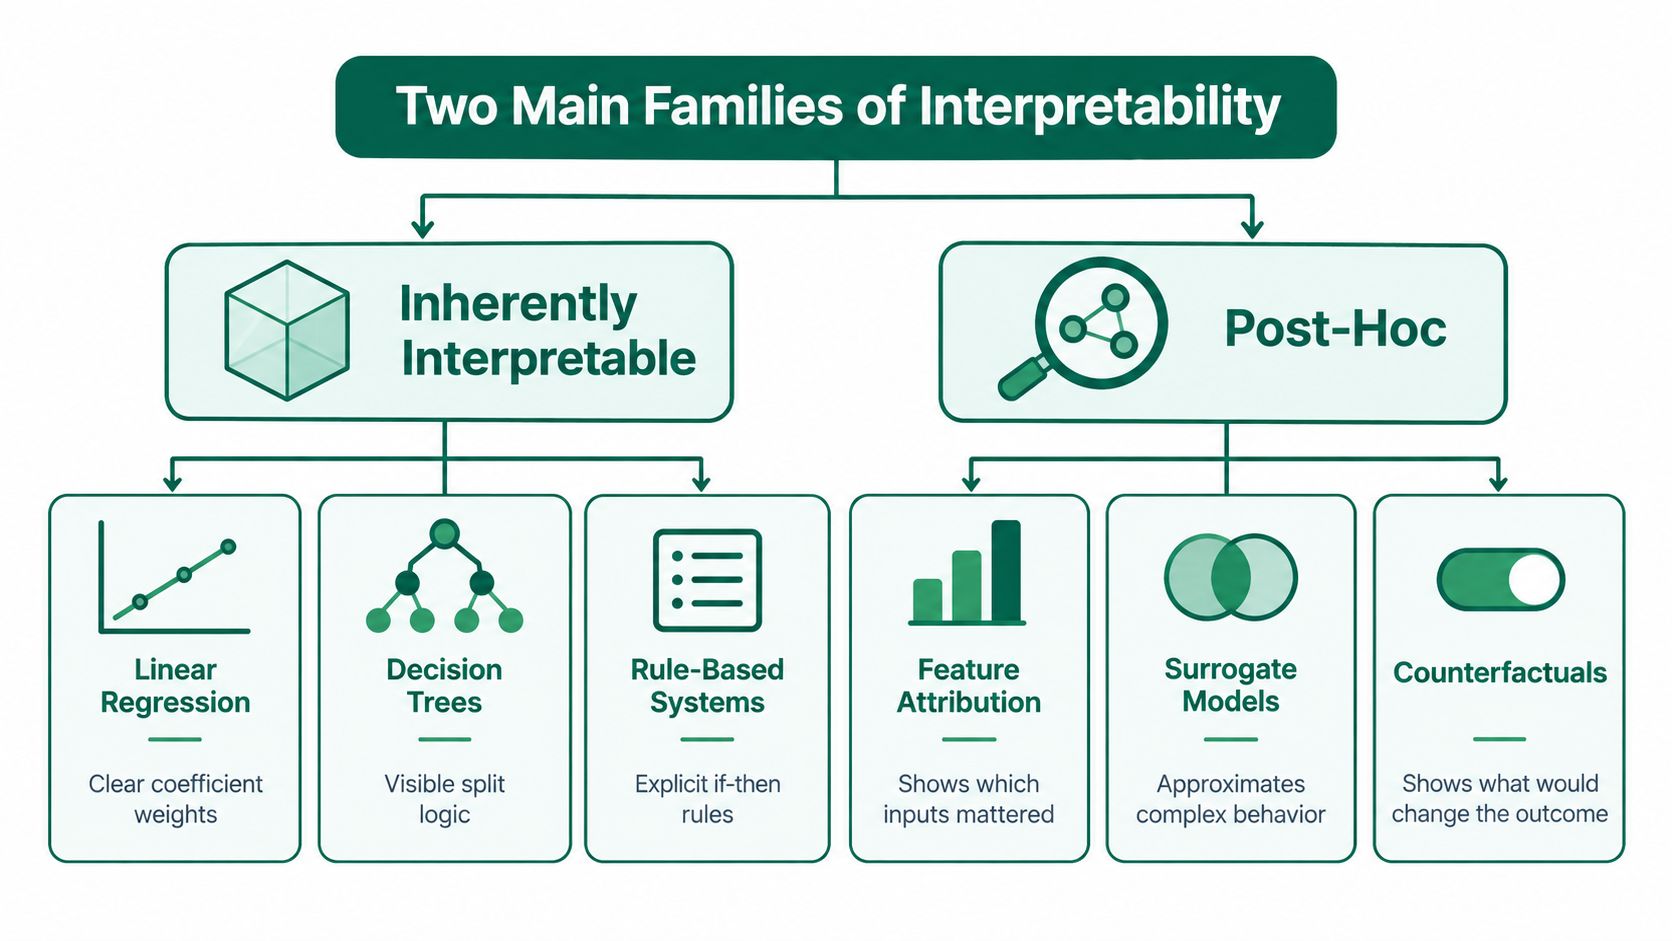
Think of terrain. An interpretable model is like land you can inspect directly. A post-hoc explanation is a map drawn after the journey. A map can be useful, but it is a representation. It can omit detail or distort the route.
That distinction matters more than any tool name.
Built In Transparency
Linear models, shallow decision trees, scorecards, and rule based systems expose part of their reasoning through coefficients, splits, points, or explicit rules. You can inspect the mechanism itself, not just a summary of it.
This doesn't guarantee a good model. A transparent model can use poor features, miss important interactions, or perform badly for a subgroup. Transparency tells you what the model does. It doesn't prove the model should do it.
Explanations Added After Training
Post-hoc methods explain a trained model from the outside. Many are model agnostic, meaning they can be applied across model families. That flexibility helps when you have an existing system or need a complex model for performance reasons.
The trade-off is faithfulness. A post-hoc method may produce a plausible story that doesn't match the model's actual mechanism, and it doesn't establish causality just because it identifies influential inputs.
The video below offers another view of how these families differ in practice.
Use this selection question first: Can a simpler, interpretable model meet the performance and risk requirements? If yes, start there. If not, use post-hoc methods, but validate them as separate components.
| Family | How it works | Typical scope | Key question |
|---|---|---|---|
| Inherently interpretable | Reasoning is part of model structure | Often global and local | Is performance sufficient? |
| Post-hoc attribution | Assigns influence to inputs | Mostly local, sometimes aggregated | Is attribution faithful? |
| Post-hoc surrogate | Simpler model approximates behavior | Local or global | Where does approximation break? |
| Example based | Shows prototypes, criticisms, or neighbors | Local and cohort level | Are examples representative? |
| Counterfactual | Shows change that flips output | Local | Is the change feasible? |
| Disclosure | States identity, purpose, limits, provenance | System level | Has the user been informed? |
A category tells you how an explanation is produced. It doesn't tell you whether anyone should rely on it.
Comparing Post-Hoc Explanation Techniques
Two methods shaped modern practice. Local Interpretable Model-Agnostic Explanations (LIME), introduced in 2016, and SHapley Additive exPlanations (SHAP), introduced in 2017, became foundational post-hoc techniques, according to a review tracing LIME, SHAP, and their research adoption. By May 2023, that review recorded approximately 12,740 Google Scholar citations for SHAP and 12,504 for LIME in the same source context.
Popularity isn't a selection criterion. What each method represents is.
SHAP Assigns Additive Contributions
SHAP gives each feature a contribution based on Shapley values from cooperative game theory, with foundations in Lloyd Shapley's 1953 work. The contributions explain how features push a prediction away from a baseline.
For tabular, tree based models, TreeSHAP uses the model's structure. That often supports more faithful attribution than sampling based approximations. In generated classification datasets, SHAP explanations were 26% more accurate than LIME on average, while a clinical cohort benchmark reported SHAP fidelity of 0.89 ± 0.04 versus 0.74 ± 0.08 for LIME, as summarized in a benchmark comparing SHAP and LIME explanation accuracy and fidelity.
Don't read those values as a universal ranking. They tell you to measure fidelity on your model, data, and cases.
LIME Builds a Local Stand In
LIME perturbs inputs around one case, observes the black box model's responses, and fits a simple surrogate such as linear regression or a shallow tree. That produces a sparse, readable account of local behavior.
Its weakness follows from its design. Random neighborhood sampling can create instance to instance variability, so repeated runs may not give identical explanations. LIME also generated explanations in approximately 0.08 seconds per instance in the clinical cohort benchmark linked above, which helps when speed matters more than maximum fidelity.
Gradient and Saliency Methods Highlight Sensitive Inputs
For neural networks, saliency maps, Integrated Gradients, SmoothGrad, and Grad-CAM estimate which pixels, tokens, or features most affect an output. They can reveal that an image model is focusing on background, a border, or another shortcut.
A highlighted region isn't a reason in human terms. It shows sensitivity under a method's assumptions. You still need to test whether removing or changing that region changes the prediction as expected.
Practical rule: Attribution tells you what influenced the model's output. It doesn't tell you what caused the real world event.
That distinction matters in regulated settings. For banking teams connecting feature attribution to review and responsibility, Visbanking on AI accountability provides useful context on why explanation needs an accountable human process around it.
| Method | Explanation form | Strength | Limitation | Best fit |
|---|---|---|---|---|
| SHAP | Signed feature contributions | Additive, auditable framing | Cost and assumptions vary by variant | Tabular and tree models |
| LIME | Local surrogate weights | Fast, sparse, model agnostic | Sampling variability | Rapid local inspection |
| Integrated Gradients | Path based attribution | Uses model gradients | Needs a meaningful baseline | Differentiable neural models |
| Saliency or Grad-CAM | Highlighted regions | Easy visual inspection | Can look plausible when unfaithful | Image model debugging |
| Attention views | Weighted tokens or regions | Shows internal weighting | Weight isn't proof of reasoning | Text inspection with validation |
Choose by model structure, data type, latency, reproducibility, and audit needs. There's no credible universal winner.
Exploring Global and Example-Based Explanations
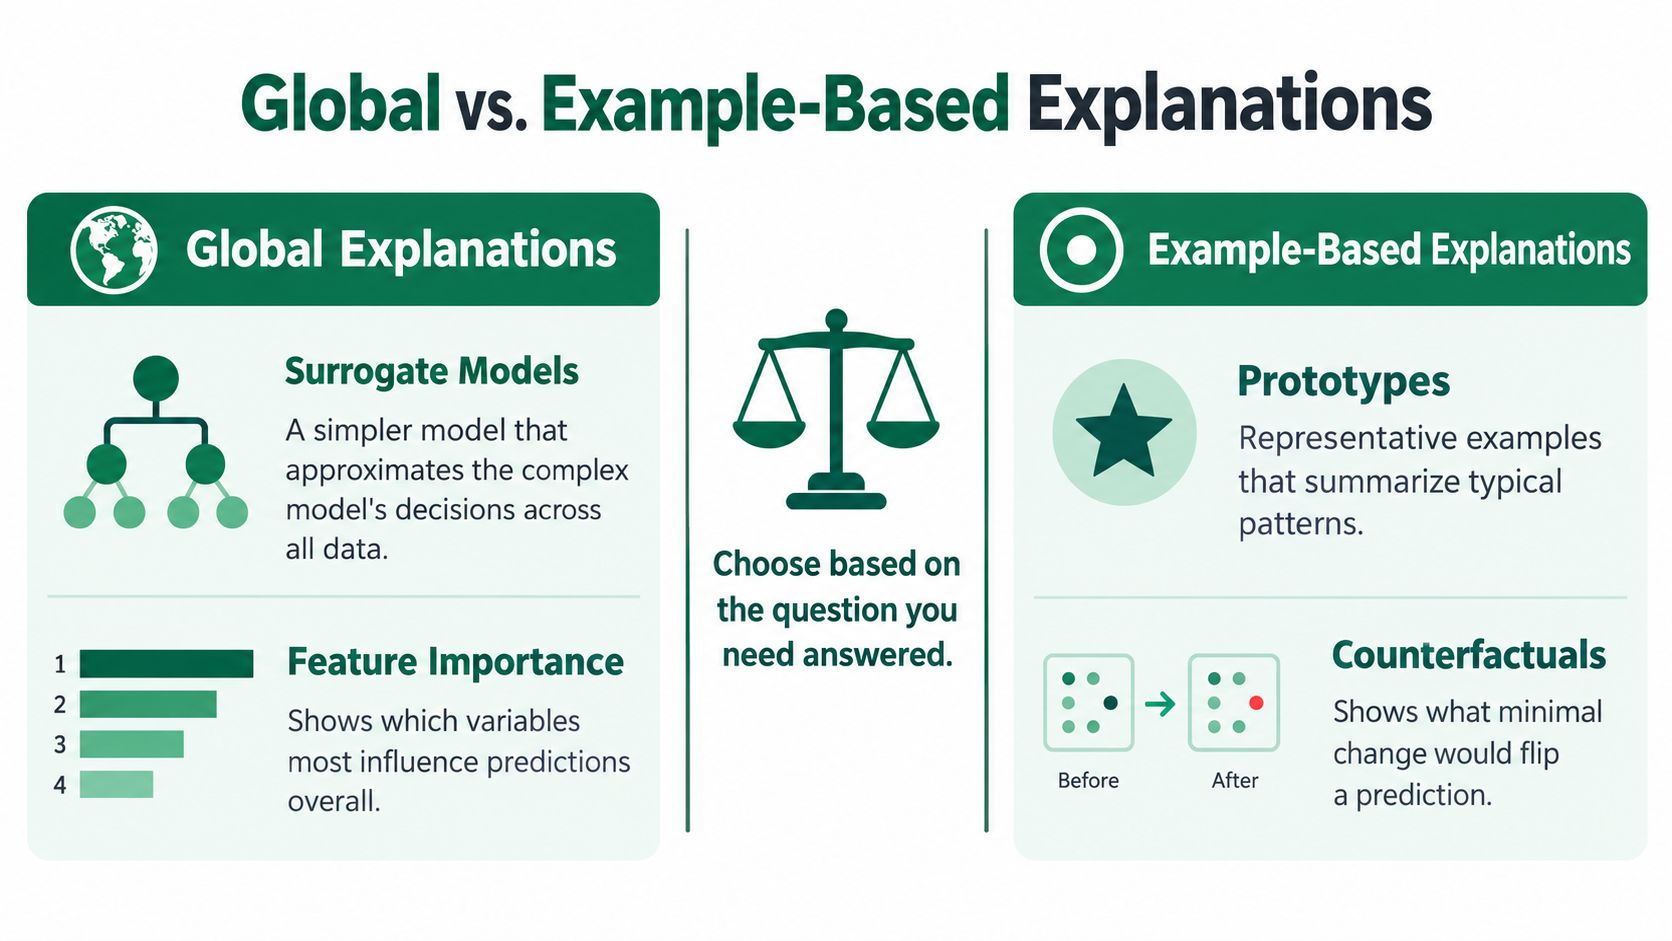
A local feature list answers, "Why this case?" It doesn't answer, "How does this model usually behave?" or "What would need to change?" Different methods handle those questions.
Surrogates, Rules, and Scorecards
A global surrogate is a simpler model trained to approximate a complex model's behavior across a dataset. It can expose broad patterns, interactions, and decision boundaries that individual explanations hide.
The danger is substitution. People start reviewing the surrogate as if it were the production model. Measure where they agree, where they diverge, and which cases the surrogate represents badly.
Rule lists and scorecards compress behavior into reviewable statements or points. They're easier to govern, but compression has a cost. Rules may miss interactions, cover only part of the population, or become outdated when the underlying model changes.
Prototypes and Criticisms
A prototype is a representative case. A criticism is a case the prototype fails to represent well. Together, they work like showing a typical approved application and then an approved application that looks nothing like it.
That pairing helps reviewers spot coverage gaps. One polished example can mislead. A contrasting example shows the boundary of the pattern.
Counterfactuals and Distillation
A counterfactual explanation identifies a change that would alter the prediction. It might show that reducing a balance or adding a document changes an outcome. Before using it, separate three questions.
- Plausibility: Could this case realistically occur?
- Feasibility: Can the person make that change?
- Causal validity: Would changing it in the world have the implied effect, or only change the model's input?
Model distillation transfers behavior from a larger model into a smaller one. It doesn't automatically transfer all knowledge, reliability, or explanation quality. Validate the student model as its own system.
| Technique | Object explained | Decision question |
|---|---|---|
| Global surrogate | Overall model behavior | What patterns drive decisions generally? |
| Rule list or scorecard | Compressed decision logic | Can reviewers inspect and govern the logic? |
| Prototype | Representative case | What does a typical pattern look like? |
| Criticism | Poorly represented case | Where does the summary break down? |
| Counterfactual | Boundary around one case | What change would flip this result? |
| Distillation | Smaller replacement model | Can a simpler model reproduce behavior safely? |
Combine levels deliberately. A global summary helps leaders govern. Local evidence helps operators act. Examples help both groups see what abstractions conceal.
Why Better Explanations Can Still Lead to Worse Decisions
Transparency can increase confidence without improving judgment. That's the risk many explainability programs miss.
NIST warns that oversimplifying models for algorithmic interpretability can impose harmful biases, a caution discussed in NIST's guidance on psychological and human factors in explainable AI. A simpler story isn't necessarily safer or more truthful.
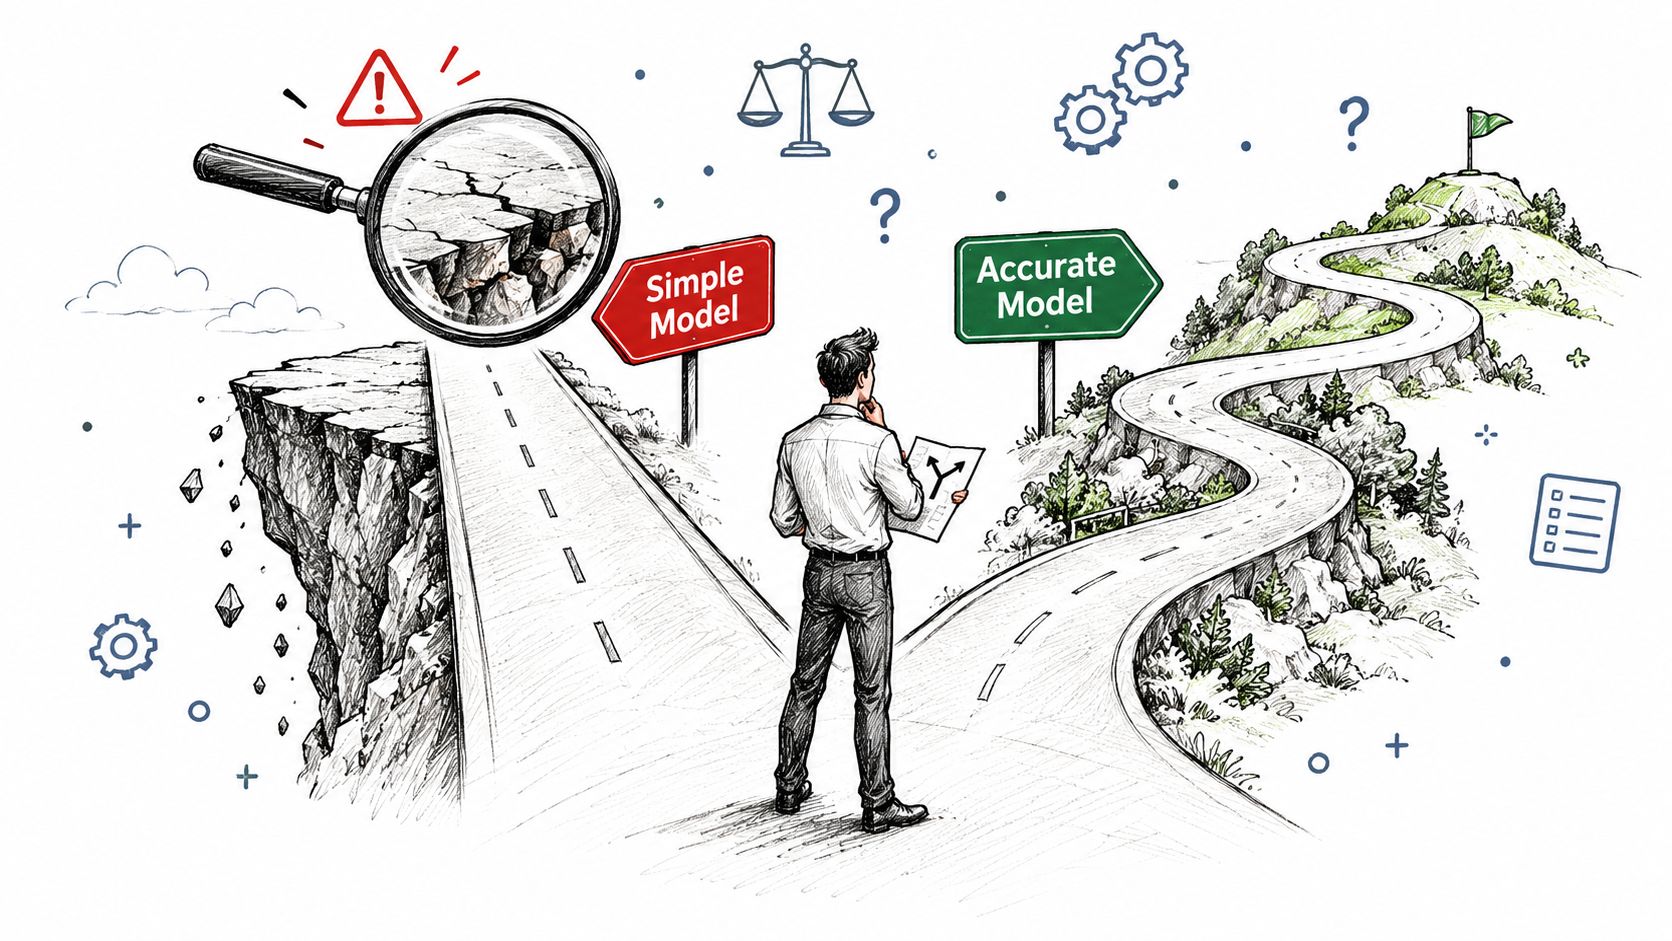
When Clarity Creates Over Reliance
A concise explanation is easier to read. It may also omit uncertainty, missing information, and competing evidence. The user feels informed and stops checking.
A dense, technically faithful explanation creates the opposite problem. An operator under time pressure can't use it, so they either ignore it or fall back on the score. Both failures look like adoption in a dashboard. Neither improves decisions.
Your understanding of bias in decision making becomes operational here. Automation bias isn't solved by adding more text beside a prediction. The interface has to make challenge possible.
Aim for Calibrated Reliance
Calibrated reliance means users trust the model when evidence supports it and question it when context, uncertainty, or counterevidence suggests risk. Design for that behavior.
- Show limits: State missing data, low confidence, and out of distribution signals.
- Show counterevidence: Include factors that argue against the prediction.
- Show abstention conditions: Define when the system shouldn't decide.
- Match the role: Give engineers traceability, analysts case evidence, and clinicians uncertainty and relevant narrative context.
Don't confuse this with every transparency duty. For systems that interact directly with people, the European Commission states that Article 50 transparency obligations apply from 2 August 2026, covering disclosure that a person is interacting with AI and machine readable marking of generated content, in European Commission guidance on AI transparency obligations. Telling someone they're using AI isn't the same as explaining a decision.
| Question | Healthy signal | Warning sign |
|---|---|---|
| Do users catch model errors? | Overrides rise on bad cases | Agreement rises on all cases |
| Is uncertainty visible? | Users escalate uncertain cases | Confidence is always presented cleanly |
| Can users challenge output? | Counterevidence is inspected | Explanation only supports score |
| Does workload stay manageable? | Review focuses on risky cases | Every case needs expert interpretation |
| Are limits acted on? | Abstentions trigger a defined route | Low confidence still produces decisions |
Measure appropriate decisions, not reported trust.
Selecting and Testing Explainable AI Methods
Don't start by picking SHAP, LIME, or a dashboard. Start with the decision, then work backward.
A Selection Sequence You Can Run
- Name the stakeholder and action: Who approves, investigates, escalates, overrides, or abstains?
- Define the explanation question: Why this case, how generally, what would change it, or when shouldn't the model act?
- Record constraints: Note data type, model family, risk, latency budget, audit needs, and usable granularity.
- Shortlist candidates: Compare methods that answer the same question, not unrelated tools.
- Validate before rollout: Test technical faithfulness and human usefulness separately.
This approach connects naturally to disciplined AI model evaluation, because the explainer needs its own acceptance criteria.
Test the Explanation, Not Only the Model
Fidelity asks whether the explanation reflects model behavior. Delete or perturb features identified as important and check whether the prediction moves as expected. If it doesn't, the explanation may be decorative.
Stability and consistency ask whether small input changes produce wildly different explanations. Repeat runs, test minimally perturbed inputs, and include adversarially perturbed cases where relevant. A distribution shift can change an explainer's local neighborhood even when classifier accuracy holds.
Evidence from intrusion detection across BoT-IoT, Edge-IIoT, and N-BaIoT datasets found SHAP showed stronger feature alignment and completeness under DeepFool perturbations, while LIME achieved greater top-k ranking stability but produced more spurious attributions, particularly with synthetic features, as reported in an intrusion detection benchmark comparing SHAP and LIME robustness. That's why one headline metric can't settle the choice.
Sparsity asks whether the explanation is focused enough to use. Completeness asks whether it leaves out material drivers. Computational cost determines whether it fits the workflow. These can conflict, so report them separately.
Test Whether People Decide Better
NIST distinguishes explanation meaningfulness from explanation accuracy and identifies human simulatability, whether people can use an explanation to reproduce or assess a decision, as one possible measure in NIST's analysis of explainable AI evaluation gaps. Accuracy alone can't establish whether deployment is appropriate because context, risk, and societal harms matter.
Run a workflow experiment. Compare explanation assisted decisions with a no explanation baseline. Measure error detection, appropriate overrides, missed failures, decision time, and outcomes on representative and edge cases.
| Dimension | Test question | Example evidence |
|---|---|---|
| Fidelity | Do important features actually drive output? | Deletion or perturbation changes prediction |
| Robustness | Does explanation survive small changes? | Stable rankings under minimal perturbations |
| Stability | Do repeated runs agree? | Consistent output across runs |
| Sparsity | Is it focused enough? | User can identify main drivers quickly |
| Completeness | Are material drivers missing? | Irrelevant features receive low attribution |
| Cost | Does it fit operations? | Latency recorded with fidelity |
| Human usefulness | Do decisions improve? | Better error detection than baseline |
Maintain method specific validation suites. Performance varies by architecture and dataset, so standardizing on one explainer across every system creates false consistency.
Matching Explanations to Real-World Decisions
A credit reviewer, a model engineer, and a clinician can look at the same score and need three different explanations. The deciding factor is the job each person must perform: investigate a case, find where behavior breaks, or judge whether reliance is safe in front of them. Treat explanation as a property of that workflow.
A fraud analyst triages a flagged payment. Signed feature contributions help them see what raised the score, but they also need competing evidence, account history, and a route to contact the customer. Attribution supports investigation. It doesn't close the case.
A software engineering team investigates repeated misclassifications in support tickets. Prototypes show the dominant pattern. Criticisms reveal tickets that don't fit it. That pairing points engineers toward labeling problems, missing categories, or product changes the model hasn't absorbed.
A clinician reviewing a risk prediction needs something else. A confident list of feature weights isn't enough. They need uncertainty, missing information, relevant narrative context, plausible counterfactuals, and clear boundaries for cases that require another route.
These are decision explanations, built for a concrete judgment at a concrete moment. They sit alongside broader transparency duties such as user notices and system documentation, which answer different questions for different audiences.
The Regulated Documentation Case
Article 13 requires high risk AI systems to be designed so deployers can interpret outputs and use them appropriately, with information covering intended purpose, accuracy, cybersecurity, foreseeable risks, limitations, and where applicable output explanation capabilities, according to the EU AI Act Article 13 transparency requirements. A visualization deployers can't understand does not meet that usability objective merely because it is mathematically elaborate.
To compare these decision patterns with documented implementations across industries and business functions, explore the Applied library of AI use cases, tools, and outcomes.
| Stakeholder | Primary question | Useful starting method | Must verify |
|---|---|---|---|
| Fraud analyst | Why was this flagged now? | Local attribution plus case evidence | Counterevidence and data freshness |
| Engineer | Where does behavior break? | Prototypes, criticisms, global summaries | Version and subgroup patterns |
| Clinician | Should I rely on this here? | Attribution, counterfactuals, uncertainty | Missing data and abstention boundary |
| Risk reviewer | Can we defend this process? | Global surrogate, rules, audit records | Fidelity and reproduction |
| Affected person | What affected my outcome? | Plain language reasons, feasible counterfactual | Accuracy and actionability |
The method follows the workflow. It serves the decision at hand.
Build an Explanation Strategy That Survives Production
Production changes the data, the users, and sometimes the decision itself. Your explanation strategy needs monitoring, not just launch approval.
Use this sequence. Specify the decision and audience. Choose the least complex model that meets performance needs. Establish an explanation baseline. Validate technical and human useful properties. Expose uncertainty and abstention conditions. Integrate the output into the existing workflow. Then monitor drift, stability, overrides, and downstream outcomes.
For teams formalizing those controls, the devPulse AI governance resource can help connect explanation evidence to broader accountability structures. Pair that thinking with your own AI governance best practices so ownership, review, and escalation don't live in separate documents.
Record Enough to Reconstruct the Decision
Store the model version, explainer version, input context, relevant features or examples, uncertainty, disclosure shown, user action, and any override reason. Without those fields, you can't investigate whether the model changed, the explanation changed, or the workflow changed.
Keep broader transparency controls distinct. European Commission guidance covers disclosure for AI interaction, machine readable marking, notice for emotion recognition or biometric categorization, and disclosure for deepfakes or certain public interest text, in European Commission guidance on transparent AI systems. One attribution method doesn't satisfy all of those duties.
| Stage | Question | Evidence to retain |
|---|---|---|
| Design | Who acts on this explanation? | Decision map and user needs |
| Validation | Does it reflect the model? | Fidelity, stability, latency results |
| Human testing | Do users decide better? | Baseline comparison and override analysis |
| Release | When must it abstain? | Thresholds, routes, instructions |
| Operation | Is it still useful? | Drift, repeated run, outcome monitoring |
| Incident review | Can we reconstruct it? | Versions, inputs, explanation, action |
Take five questions into design review. Can the user assess the decision? Does the explanation match actual model behavior? What happens at low confidence? Does it remain stable under small changes? Can the team detect when it stops being useful?
If you can't answer those, you don't have an explanation strategy yet. You have an explanation feature.
Create an account or subscribe at Applied to explore a curated library of AI use cases, tools organized by industry and business function, and documented outcomes you can compare with your own explainability decisions. Use those real implementations to see how other teams structure review, accountability, and production monitoring before you lock in your next model or explanation method.