AI Market Map: A Practical Guide for Leaders
Learn how to read and use an AI market map for strategy, procurement, and roadmapping, with verified examples and a leader's action checklist.
October 17, 2026
Only 39% of respondents reported any enterprise-level EBIT impact from AI, and most of those said AI contributed less than 5% of EBIT, even as adoption spread across organizations. That gap is why a useful AI market map can't stop at listing vendors. Leaders need to see which tools have reached production, what outcomes they deliver, and what infrastructure economics sit behind them. (McKinsey's 2025 State of AI survey)
A vendor grid can tell you who sells models, platforms, or applications. It can't, by itself, tell you what to buy, where to invest, or which deployment to sequence first. Treat the map as an outcome-tracking instrument, not a directory.
Table of Contents
- Why Most AI Market Maps Fall Short for Decision-Makers
- What an AI Market Map Actually Is
- How Credible AI Market Maps Are Built
- Three Jobs an AI Market Map Should Do for Leaders
- How to Read a Market Map Like an Analyst
- Verified Deployments That Show the Map in Practice
- Limits, Biases, and Update Cadence to Watch
- A Leader's 30, 60, and 90 Day Action Plan
Why Most AI Market Maps Fall Short for Decision-Makers
Consider a procurement shortlist built from an “agent platform” category. A vendor earns a place because its product promises to automate customer support, yet the buyer has no evidence of deployment beyond a demonstration. Workflow ownership, exception handling, and operating costs remain unresolved. Category placement has given an untested option the appearance of procurement readiness.
That missing evidence creates a practical risk: buyers compare product positioning while leaving implementation burdens out of the decision.
Reliability deserves its own place on the map. According to McKinsey's 2025 State of AI survey, 51% of organizations using AI had experienced at least one negative consequence, with inaccuracy a leading source. Procurement teams should ask how errors are detected, who handles them, and whether human review costs are included in the business case.
What the vendor grid leaves out
Labels such as “copilot” and “vertical AI” group products with potentially different deployment requirements. A customer-support assistant that drafts responses for review and one authorized to resolve cases belong to different operational risk profiles. Their shared category leaves that distinction invisible.
Attach production status, workflow owner, deployment maturity, time to impact, reliability, and verified outcome to each shortlisted entry. Separate demonstrations, pilots, and functioning deployments. Mark missing evidence explicitly rather than allowing a prominent logo to imply maturity.
Then connect those fields to economics. Record whether the claimed benefit reaches enterprise-level EBIT, remains a workflow improvement, or has yet to be measured. Include the infrastructure and review requirements needed to sustain that outcome. A faster process can still carry costs that weaken its business case.
Practical rule: Require a named workflow owner and evidence of what changed after deployment before advancing a vendor to procurement.
Leadership teams should prioritize use cases with demonstrated results under comparable operating conditions. Those conditions make a roadmap defensible and expose where further validation is required before spending.
What an AI Market Map Actually Is
An AI market map is a structured view of vendors, tools, and deployment patterns across the AI stack. Think of the difference between a city map and a transit map. A city map shows streets and physical locations; a transit map simplifies geography into routes, connections, and stations so you can decide how to get somewhere. An AI market map should do the same for a complex vendor field: make the relationships between technology layers and business use cases legible.
The common taxonomy has four layers. Each layer answers a different procurement question, so leaders should classify vendors by what they provide, not just by brand recognition.
The four layers
- Infrastructure supplies compute, storage, data systems, and networking. This includes semiconductors, cloud providers, data centers, and other resources that affect availability, deployment options, and cost.
- Foundation models are the core neural networks that generate or interpret text, images, audio, code, and other inputs. Buyers compare model capabilities, serving options, reliability, and workload fit.
- Platforms and tools help teams build, connect, manage, and evaluate AI workflows. Orchestration, fine-tuning, retrieval, and evaluation capabilities sit here.
- Applications put AI in front of users or embed it in a business process. Examples include customer-service assistants, coding tools, search products, and industry-specific applications.
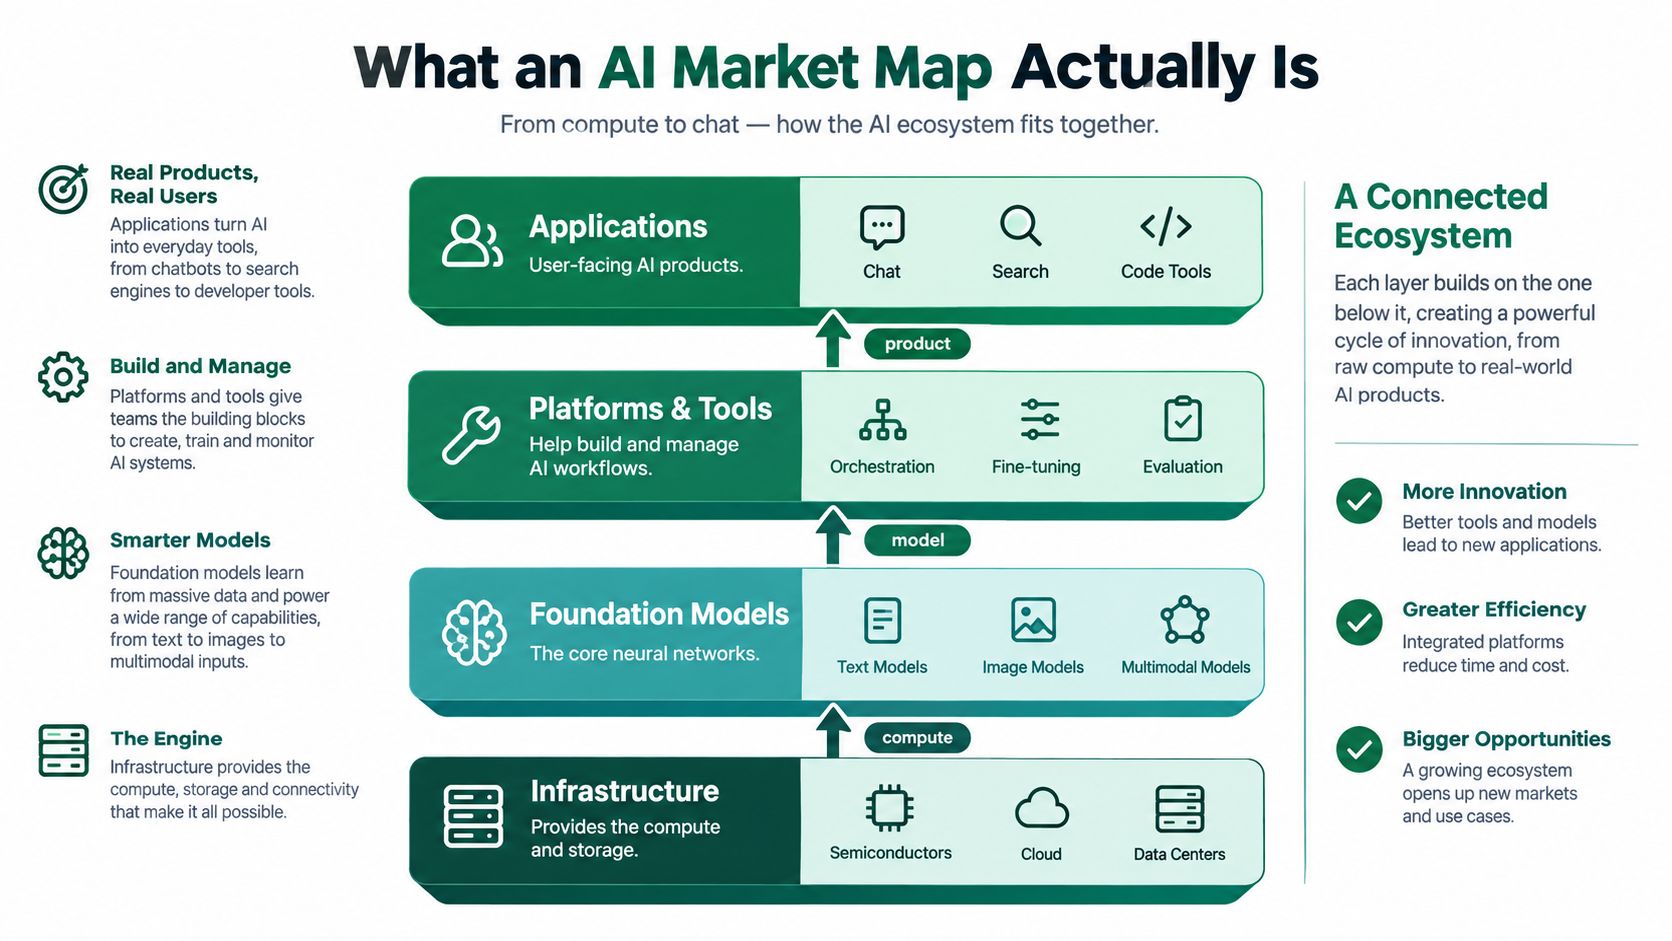
Labels like “agent platform” and “vertical AI” can cut across layers. An agent platform may rely on foundation models and infrastructure supplied by other vendors, while a vertical application may combine models, data, and workflow software behind one product. The map should show those dependencies rather than implying that every company owns the entire stack.
Regional discovery can also help teams find relevant providers. For example, leaders looking for vendors in Australia and New Zealand can find AI platforms in ANZ, then place those vendors into the relevant layer and evaluate their deployment evidence.
A serious map adds outcome dimensions alongside the technology taxonomy: whether a product is experimental or in production, who owns the workflow, how mature the deployment is, and what results the organization has measured. Without those fields, the map explains what exists, but not what deserves investment.
How Credible AI Market Maps Are Built
A market map is only as credible as its evidence trail. A vendor's own website can establish what a product claims to do, but it doesn't independently establish production usage or business impact. Strong maps combine vendor documentation with public case studies, customer disclosures, and structured tagging that lets leaders compare companies across industries and business functions.
The distinction between a funded-startup list and a verified-deployment catalog is fundamental. A funding announcement tells you something about capital and investor interest. It doesn't show that a product is installed in a live workflow, who uses it, or what changed as a result. A deployment record should identify the company, the use case, the tools involved, and the outcome evidence. When public disclosures don't support an outcome claim, the map should say so rather than fill the gap with inference.
Test the method, not the polish
| Source | What it adds | Main weakness |
|---|---|---|
| Public customer case studies | Named customers, workflows, and sometimes measurable outcomes | Companies may select favorable examples |
| Vendor documentation | Product capabilities, integrations, deployment options, and stated limitations | Claims are vendor-supplied, not independent proof |
| Earnings calls and company disclosures | Signals about operational priorities and business results | AI use may be described without identifying tools or isolating impact |
| Customer references | Direct detail about implementation, support, and workflow fit | Access may be limited, and references can be selected |
| Structured use-case catalogs | Consistent tags across sectors, functions, tools, and outcomes | Quality depends on sourcing standards and update discipline |
Coverage bias needs active scrutiny. A map built mostly from English-language public disclosures may overrepresent the United States and large technology companies, while vendor-supplied success stories can skew the evidence toward favorable implementations. Leaders should check whether the map names companies and tools, separates reported outcomes from projections, and indicates when evidence was last reviewed.
A glossy annual PDF can become stale as products and deployments change. A living map should be updated as new evidence appears and retain enough sourcing detail for a reader to verify an entry. For an example of research organized around applied AI patterns, review the State of Applied AI report. Treat the map as a maintained evidence base, not a one-time market snapshot.
Three Jobs an AI Market Map Should Do for Leaders
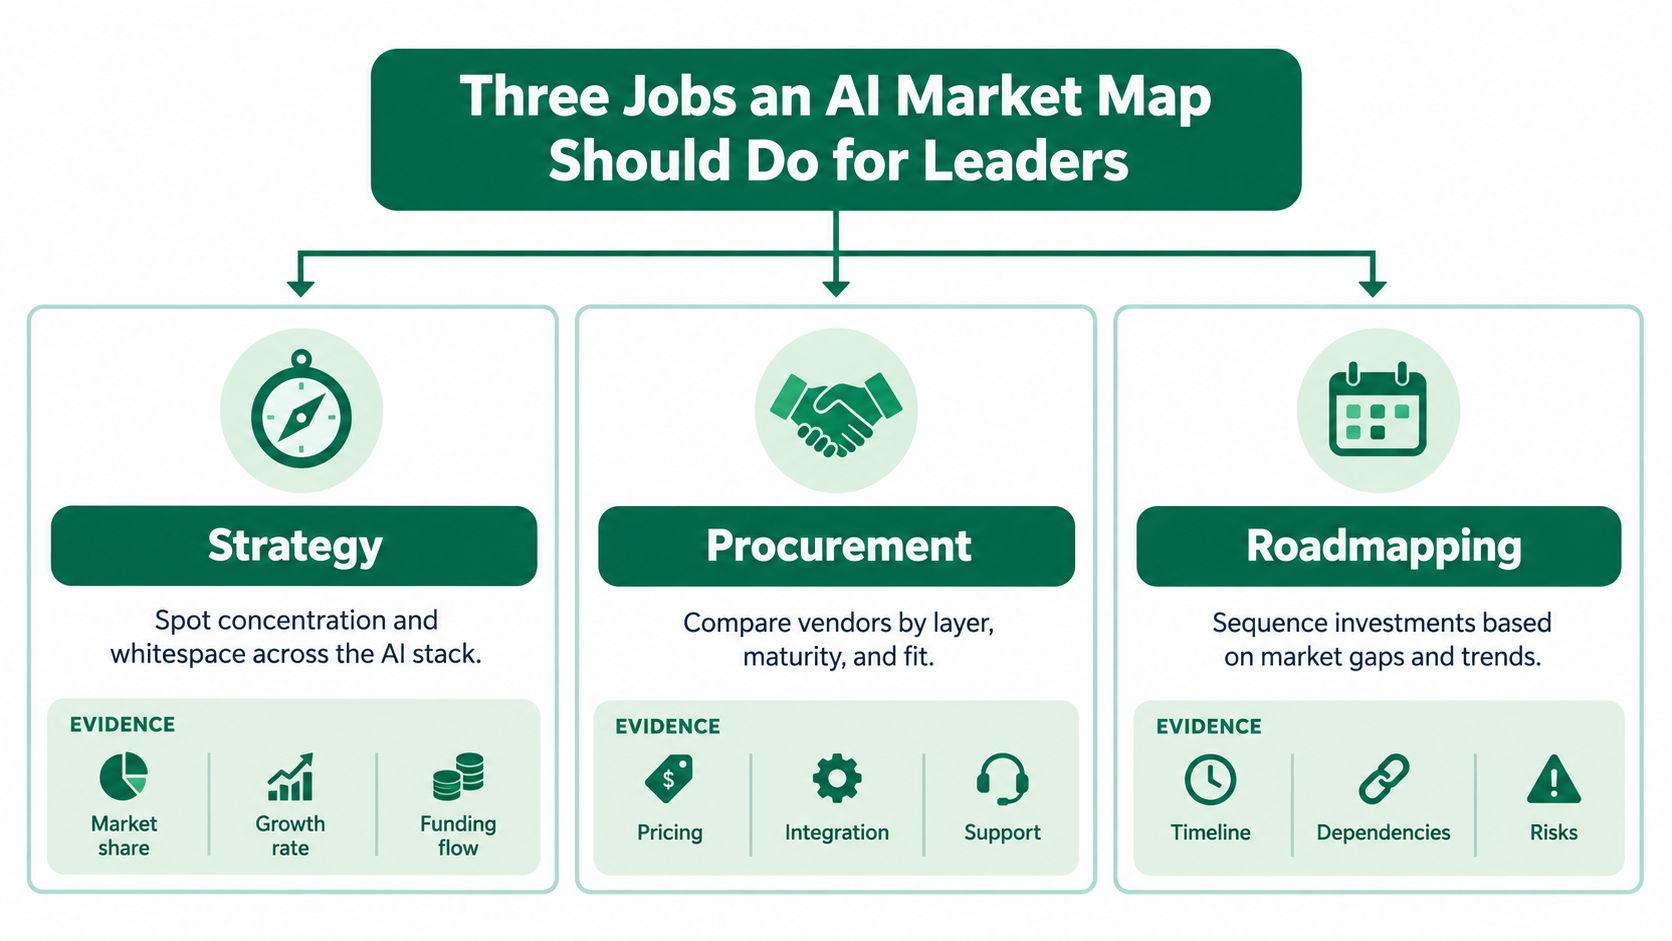
Strategy, procurement, and roadmapping all use market maps, but they require different evidence. Ask what decision you're making before comparing vendors. The same company can look strategically important, operationally unsuitable, and premature for a deployment plan.
Strategy identifies where to play
At the strategy level, leaders need to understand how the market is distributed across layers and where concentration or whitespace may matter. UN Trade and Development estimated the global AI market at approximately $189 billion in 2023 and projected it to reach $4.8 trillion by 2033. It also projected AI's share of the broader frontier-technology market to rise from 7% in 2023 to 29% in 2033. (UN Trade and Development's AI market projection) This scale reinforces the need to map more than application startups: infrastructure, models, industrial systems, and services all shape where value and dependency sit.
Procurement tests fit in a real workload
Procurement teams need to compare a vendor against the workload, not against a quadrant position. Their evidence bar includes integration depth, data handling, reliability, support, and economics under expected production conditions. A vendor can be well known and still fail on data residency, operational controls, or the latency a specific process requires.
Roadmapping sequences investment
Roadmapping asks what can be deployed now, what depends on another system or team, and what proof leaders need before expanding. An experiment may be promising but require data cleanup or process redesign before it can move into functional production. A map that records maturity and dependencies helps leaders sequence work instead of funding disconnected pilots.
| Decision | What the same vendor entry needs to show |
|---|---|
| Strategy | Its position in the stack, market concentration, and relevance to the organization's priorities |
| Procurement | Workload fit, integration, reliability, controls, and operating economics |
| Roadmapping | Deployment maturity, dependencies, ownership, and evidence required for the next stage |
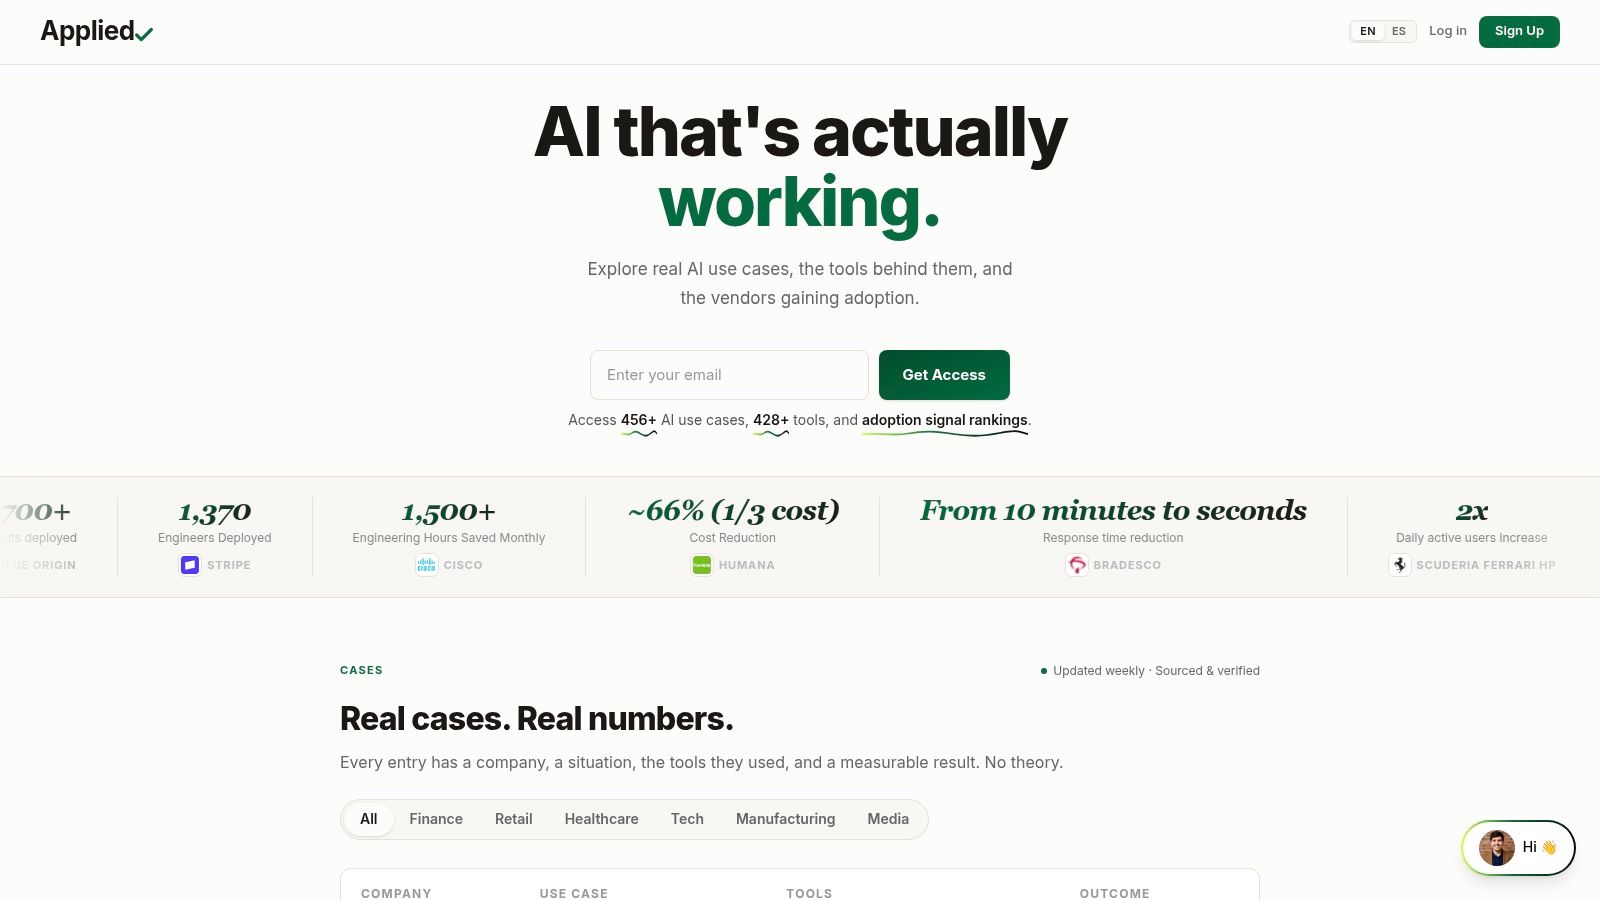
The evidence layer matters across all three jobs. A curated source that catalogs use cases across companies and functions can help leaders move from a category label to an actual deployment record. Applied, for example, organizes real implementations by company, industry, business function, tools, and outcome, making it one possible input to market research rather than a substitute for internal evaluation.
How to Read a Market Map Like an Analyst
Start by looking below the application layer. A polished user-facing product can hide dependencies on cloud capacity, model providers, data platforms, and integration tools. Those dependencies shape cost, resilience, portability, and data control, so they matter as much as the front-end feature set.

Read the stack as a set of trade-offs
Stanford's 2025 AI Index describes two different economic forces in the model layer. Training compute for notable models is doubling roughly every five months, while inference for a system performing at GPT-3.5 level on the MMLU benchmark fell from $20 per million tokens in November 2022 to $0.07 by October 2024. (Stanford's 2025 AI Index on AI research and development) For buyers, the lesson isn't to select a model by name or token price alone. Match the model to the workload, and assess quality, latency, context limits, hardware requirements, and reliability under production traffic.
Consider an abstract market map with a cloud provider, a model vendor, a workflow platform, and a customer-service application. A decorative map would display four logos and call the application “AI-powered.” An analyst asks which vendor holds the data, where inference runs, how the application connects to the case-management system, and what happens when its output is wrong or the service is unavailable.
That assessment should include three filters:
- Production deployment: Is the tool used in a live workflow, or is the evidence limited to a demonstration?
- Named outcome: What operational result does the customer report, and how was it measured?
- Workflow ownership: Which team is accountable for exceptions, approvals, and ongoing performance?
Use those filters to turn visual categories into procurement questions. Ask about latency ceilings, data residency, permission controls, observability, and rollback behavior. Compare total cost of ownership and switching costs for the specific workload rather than assuming cloud convenience or a model's brand settles the question.
The numbers on the model layer are only part of the story. Buyers also need to know whether their intended use case favors a smaller optimized model or a more capable model, and how infrastructure choices affect control and portability. For a view of signals connected to actual adoption, explore AI adoption signals.
Verified Deployments That Show the Map in Practice
A useful market-map entry makes the workflow and evidence visible. It names the customer, the tool, the deployment context, and the result, then leaves room for questions about scope and measurement. Without those details, a map can't help a buyer distinguish an established operating pattern from an attractive story.
Take an engineering deployment associated with Stripe-scale use. If an agentic coding tool is used across more than a thousand engineers to reduce multi-week migrations to days, the entry should make the engineering workflow and deployment scope clear. A procurement team should still check which migration tasks the tool handled, what review engineers retained, and how the result was measured before treating the example as a forecast for its own environment.
A GitLab-style example has a different lesson. Embedded models across an internal DevSecOps workflow may be associated with 25% to 50% productivity gains, but the map must identify what productivity means in context. Is the measure tied to code review, issue resolution, or another task? Which teams participated, and what safeguards kept generated work reliable? A percentage without a defined workflow isn't enough to support a buying decision.
Compare the workflow, not the headline
A Salesforce Dreamforce-scale event-agent example illustrates why the data layer belongs on the map. An agent that uses unified customer data to support tens of thousands of personalized interactions has a different dependency profile from a general chatbot. Leaders should examine the data connections, permission model, and escalation path alongside the apparent scale of the experience.
A service-operations automation case gives procurement a more direct operational metric. A reported 97% reduction in operation time can indicate a compelling workflow opportunity, but the entry should clarify the task boundary, baseline, and any human review that remained. Buyers need to know whether the measured time includes exceptions and downstream work, not just the automated step.
The pattern behind these examples is more valuable than the logo. A strong entry describes a specific workflow, identifies the tools used, states the operational result, and leaves the measurement open to scrutiny. For another example of an enterprise implementation, review PwC's use of CrewAI to accelerate enterprise-scale generative AI adoption. That kind of record helps a leadership team form better questions, not assume another company's result will transfer unchanged.
Limits, Biases, and Update Cadence to Watch
More vendors don't automatically make a better market map. More entries can make the map noisier if it doesn't distinguish experimental products from deployments, reported outcomes from verified ones, or an application from the infrastructure it depends on.
AI in production can produce negative consequences, including inaccuracy, and adoption can advance faster than financial impact. Those risks should appear in the map as operational fields: error rates, human-escalation paths, controls, and the maturity of the deployment. A vendor grid that records category and company name but omits these details hides risks procurement teams will eventually have to manage.
Infrastructure can create another blind spot. Hyperscaler convenience may come with concentration, cost exposure, or switching friction, while alternative deployments can introduce their own operational and support requirements. Compare architectures by workload, including utilization, latency, data-protection needs, portability, and the cost of moving later.
A market map should make uncertainty visible. If an outcome is vendor-reported, label it that way; if a deployment date or customer reference is missing, don't imply the evidence is complete.
Coverage can also tilt toward regions and companies with more public disclosures. Leaders should pressure-test entries against customer references and company disclosures, ask vendors for production dates, and record when evidence was checked. Review categories quarterly, while scanning continuously for newly deployed use cases. A map that gets refreshed as evidence changes is more useful than a larger catalog that ages.
A Leader's 30, 60, and 90 Day Action Plan
Days 1–30: Pick two business functions where AI could produce measurable value. Shortlist five to eight named deployments from a verified use-case library, then benchmark each against your current workflow.
Days 31–60: Build a procurement comparison covering workload economics, integration depth, observability, rollback behavior, and vendor lock-in. Eliminate options that can't meet the workflow's operating requirements.
Days 61–90: Sequence the chosen deployment, set a first-quarter outcome metric, and establish a regular review of map updates. Create an account at Applied to explore its library of AI use cases, tools by industry and business function, and weekly insight reports; research and consulting support can also help with strategy and implementation.
Applied provides a searchable library of real AI implementations, tools, industries, business functions, and outcomes that leaders can use to build an evidence-based AI market map. Visit Applied to explore deployments and use cases that can inform your strategy, procurement, and roadmap decisions.