AI Lead Scoring: Definition, Deployment, and ROI
Master AI lead scoring with a practical guide covering models, deployment, KPIs, and ROI. Learn how to prioritize high-value prospects using machine learning.
October 14, 2026
Conventional lead scoring typically converts about 5% of leads into customers, while predictive lead scoring averages about 15%. That difference is why AI lead scoring matters, not because it sounds advanced, but because the same lead pool can produce far more sales-ready opportunities when the ranking is better.
The conversation around AI lead scoring often gets lost in model names and vendor claims. The underlying question is simpler: does the score change what sales does next, and does that create revenue, or just a prettier queue?
Table of Contents
- What AI Lead Scoring Actually Delivers
- How Machine Learning Models Prioritize Leads
- What the Research Data Actually Shows
- Choosing Between Modeling Approaches
- Why High Accuracy Does Not Equal Revenue
- Deploying and Integrating Lead Scoring Systems
- Measuring Real Business Impact and ROI
- Learning from Real Implementations
What AI Lead Scoring Actually Delivers
The strongest reason to use AI lead scoring is the practical gap between a fixed ruleset and a model that learns from historical conversions. A 2023 peer-reviewed review found that conventional systems average about 5% lead-to-customer conversion, while predictive systems average about 15%. For a team working 10,000 leads, that directional benchmark corresponds to roughly 500 customers under the traditional approach and 1,500 under the predictive one, assuming comparable conditions and a similar funnel definition (source review).
That doesn't mean the model is magic. It means the qualification process became more data-driven, moving from manually assigned points to patterns learned from observed behavior and historical outcomes.
What changes in practice
Traditional scoring usually hands out points for obvious attributes, like job title, company size, email engagement, or website activity. AI systems look at the same kinds of signals, then learn which combinations correlate with conversion. That shift matters because a lead with a strong title and weak intent can outrank a smaller account that's actively researching now.
Practical rule: treat the score as a decision support tool, not a verdict. If sales never acts differently when the score changes, the system isn't doing useful work.
A good way to frame the topic is to ask whether the score helps you avoid wasting rep time on low-propensity accounts. That's why a resource like fixing a chaotic B2B pipeline is useful, it keeps the conversation anchored on qualification discipline rather than dashboard vanity.
The important caveat is that the 5% versus 15% comparison is directional, not universal. Conversion rates shift with industry, funnel definition, data quality, sales process, and the time window used. Still, even modest gains in identifying high-propensity prospects can meaningfully change how many opportunities emerge from the same inbound flow.
How Machine Learning Models Prioritize Leads
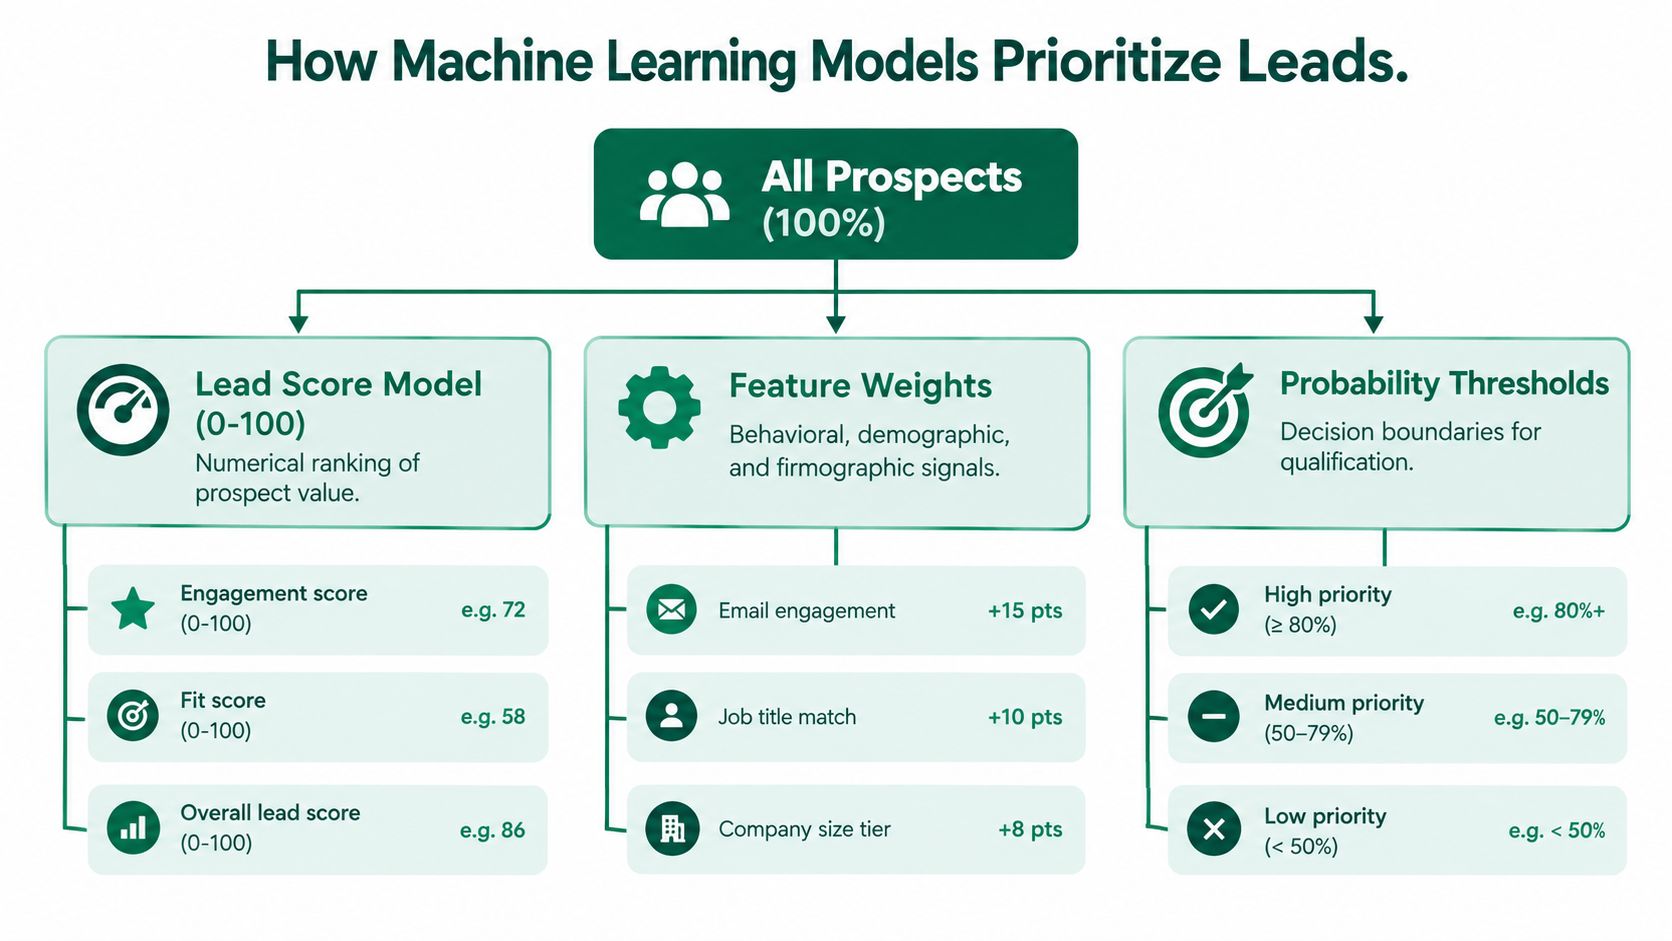
AI lead scoring replaces fixed point rules with a probability model learned from historical outcomes. Rather than treating one webinar attendance or title match as equally meaningful in every account segment, the model weighs signals together and estimates conversion likelihood. The practical shift is from isolated activities to combinations of behavior, timing, and account context.
From rules to learned probabilities
Rule-based systems assign points in advance. ML systems examine past wins and losses, then estimate which patterns preceded conversion. Useful inputs typically include intent signals, engagement recency and frequency, and firmographic variables.
Many implementations translate the output into a 0 to 100 score so sales can prioritize a workable queue. The number has value only when the underlying records are current and the conversion event is defined consistently. Messy CRM fields, inconsistent lifecycle stages, or changing labels can produce a confident ranking built on the wrong outcome.
Models don't fix broken process definitions. They amplify them.
Validation should test more than whether a model ranks historical leads. Teams also need to check calibration, stability across time, and whether representatives change their actions at the chosen threshold. The guidance on model evaluation in applied AI systems provides a useful reference for that discipline.
What the architecture needs
Classification remains the dominant modeling approach in the literature. Decision trees and logistic regression remain common because revenue teams can explain their outputs, inspect inputs, and validate threshold changes. More complex methods may improve ranking, but they also increase monitoring and interpretation requirements. Choose the method that matches data quality, feature availability, and the decisions sales can realistically make.
A practical operating model includes:
- Clean the inputs: remove duplicates, normalize lifecycle stages, and review missing fields.
- Engineer features: combine behavior, timing, and firmographics rather than relying on one event.
- Validate by time: separate training and testing periods so changing buying behavior is visible.
- Measure at the cutoff: optimize for the lead volume sales can contact promptly.
The cutoff connects model quality to revenue operations. A score that ranks well but sends more leads than sales can handle may create slower follow-up and no economic gain. For examples of local prospecting workflows, finding local leads with AI offers adjacent context on how discovery and prioritization fit within the same operating stack.
What the Research Data Actually Shows
A 2025 study of 9,240 leads across 37 features provides a useful test case for AI lead scoring. The dataset included online behavior, engagement signals, and demographic characteristics, creating the kind of mixed record set revenue teams often manage rather than a simplified classroom exercise (study PDF).
What the models did well
After dimensionality reduction and tuning, a stacking ensemble reached 92% accuracy and an AUC of 0.967. An RBF-kernel SVM reached 91.8% accuracy using 25 principal components, C=10, and gamma=0.01 (study chapter). These results show what a model can achieve when historical labels are dependable and the available features capture meaningful differences between leads.
Those metrics still do not establish revenue impact. Sales teams rarely contact every lead with equal urgency. They work a limited queue, so the operational test is whether the score places stronger opportunities near the top and improves the handoff decision.
Why ranking beats raw classification
The same research area also examined an educational-lead dataset of about 9,000 records, with a historical conversion rate near 38%. Its lift analysis estimated that concentrating attention on the top 30% to 35% of scored leads could produce conversion around 80%. Treat that result as an upper bound from one favorable segment, then test the concentration effect on your own data before planning capacity around it.
Two operating requirements follow:
- Use labeled history. Sparse, inconsistent, or poorly defined outcomes give the model little basis for useful prioritization.
- Test concentration at the sales cutoff. A ranking creates value only when the highest-scored group converts well enough to justify faster or more frequent follow-up.
The practical question is not whether another team matched these figures. It is whether your score changes who sales contacts first, whether those leads convert at a higher rate, and whether the improvement outweighs the cost of acting on the ranking.
Choosing Between Modeling Approaches
The right model depends on how sales will use its output. A transparent classifier may support adoption and review, while an ensemble may rank opportunities more effectively at the cost of explanation and maintenance.
A practical comparison
| Model Type | Accuracy Potential | Interpretability | Data Requirements |
|---|---|---|---|
| Decision trees | Moderate | High | Moderate |
| Logistic regression | Moderate | High | Moderate |
| Regression-based probability scoring | Moderate to high | Medium | Moderate |
| Gradient boosting | High | Lower | Higher |
| Stacking ensembles | High | Lower | Higher |
A literature review of 44 lead-scoring studies found classification was the dominant approach, with decision trees and logistic regression among the most frequently used algorithms (review). The finding reflects a practical constraint: revenue teams need to explain score changes to sales managers, adjust routing rules, and challenge questionable inputs.
What to choose first
Start with the simplest model that improves prioritization over the current process. If sales leadership needs a clear reason for each score, decision trees or logistic regression usually offer a workable starting point. If the team has consistent historical labels, enough meaningful features, and capacity to monitor a more complex system, gradient boosting or stacking may produce stronger rankings.
The X Education study reported that a stacking ensemble outperformed individual algorithms, but that result does not justify choosing the most complex model by default. Complexity adds monitoring, retraining, and explanation requirements.
Compare each candidate at the actual sales cutoff, then test it against a simple rule and existing seller judgment. Review missing data, label leakage, inconsistent conversion definitions, and temporal drift before increasing model complexity. A model that wins on validation metrics but does not change lead assignment or follow-up priority has not yet created operational value.
Why High Accuracy Does Not Equal Revenue
This is the part most vendor decks gloss over. A model can look excellent on paper and still fail to move revenue because it learned process artifacts instead of real buyer intent.
The problem with process artifacts
A 2025 peer-reviewed case study used real CRM data from January 2020 through April 2024 and tested 15 classification algorithms. Gradient boosting performed best, and lead source plus lead status were among the most influential features (Frontiers case study). That's useful, but it also raises a warning flag. Those variables can reflect how a company routes and labels leads, not just what buyers actually want.
A high ROC-AUC score doesn't prove incremental revenue, lower acquisition cost, or better seller productivity. It only says the model ranks the historical data well.
If the strongest feature is created by your own operating process, the model may be learning your workflow, not your market.
What proves economic value
The measurement design has to go beyond accuracy. Randomized holdouts, lead-routing experiments, calibration by segment, and comparison against simple rules or salesperson judgment are the kinds of tests that show whether scoring changes decisions. Teams also need to watch the false-positive cost, missed high-value accounts, sales-cycle effects, and performance across new versus existing segments.
Model decay matters too. A model trained on past closed-won patterns can drift badly when pricing, channels, buying committees, or qualification practices change. That's why a score should be treated as a living operational system, not a one-time analytics project.
If the model doesn't change routing, follow-up speed, or rep prioritization, it may be impressive, but it isn't adding much value.
Deploying and Integrating Lead Scoring Systems
Deployment begins with an operating decision: which score should trigger action, and can sales handle the resulting volume? A practical setup often uses a 0 to 100 scale, with the marketing-qualified-lead threshold starting around 60 to 70 points. Recalibrate it after 60 to 90 days of live data, using acceptance, follow-up, and downstream outcomes rather than model accuracy alone (operational guidance). Sales and marketing should set the threshold together. A score that exceeds rep capacity will be ignored.
The workflow that actually holds up
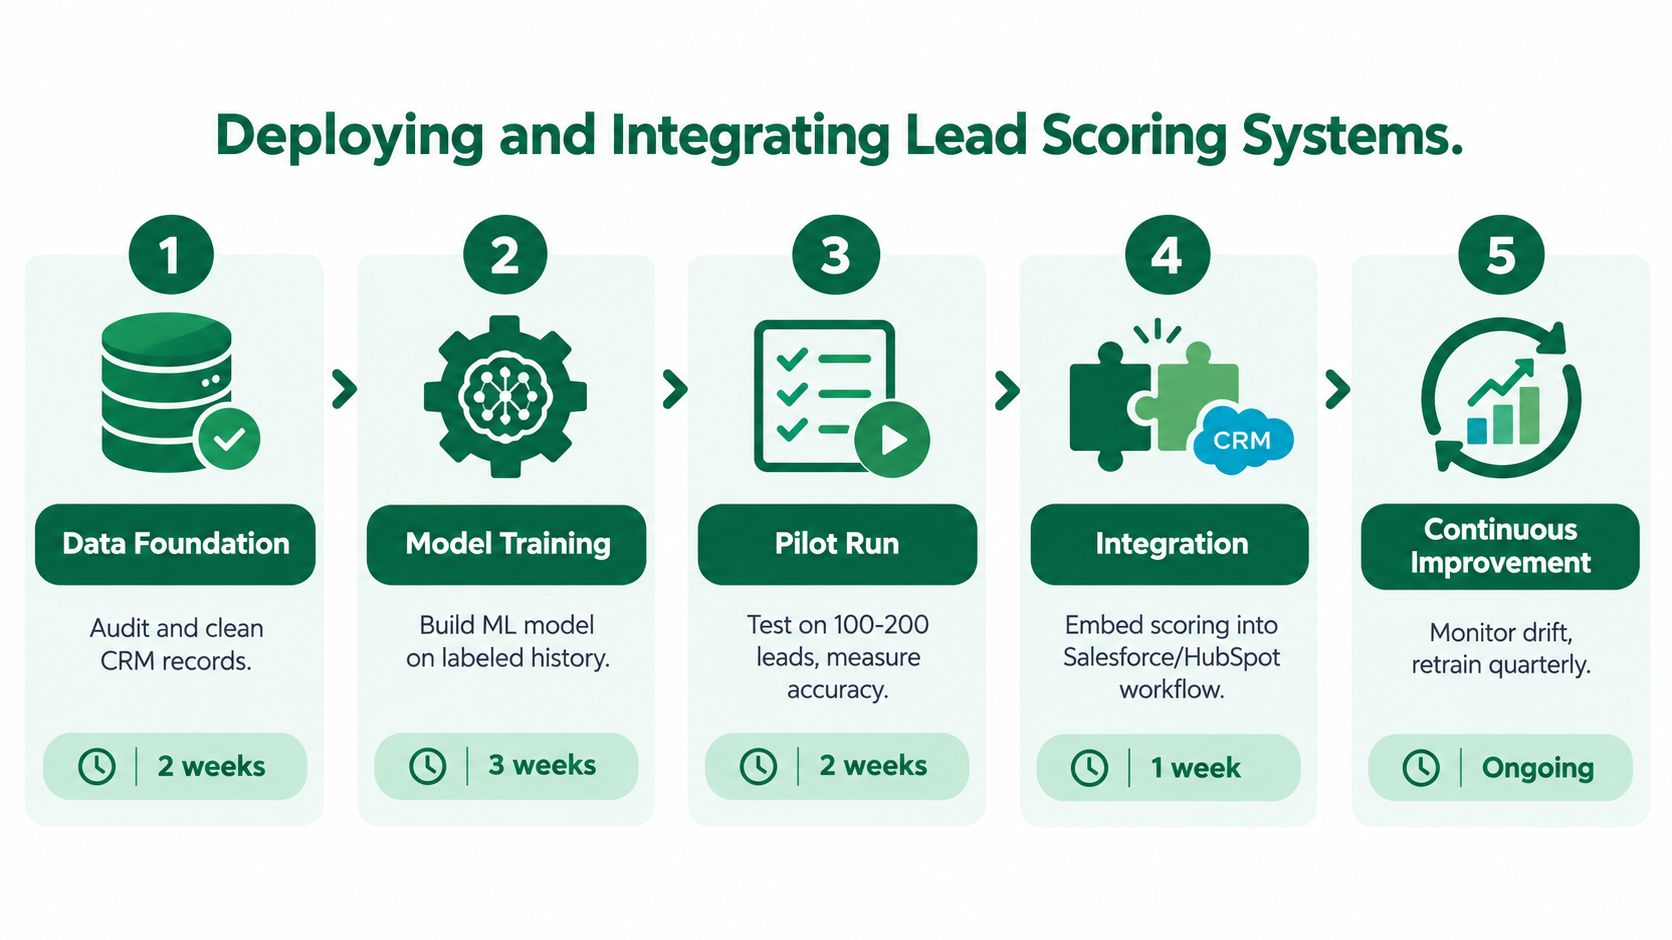
A reliable rollout follows five steps:
- Audit the data foundation. Check CRM completeness, duplicate records, and conflicting lifecycle definitions.
- Train on labeled history. Use historical conversions and disqualifications, not engagement volume alone.
- Pilot on live leads. Run the model beside the existing process before allowing automated routing.
- Integrate with CRM and automation. Put scores, reasons, and recommended actions where reps already work.
- Monitor drift continuously. Review performance when buyer behavior, channels, or qualification rules change.
The technical setup deserves the same attention as the model. CRM, marketing automation, product usage, and engagement events need consistent identities, timestamps, and lifecycle states. Teams evaluating data integration platform design should focus on those controls because stale or mismatched inputs can make a well-trained model operationally unreliable.
How to tune the threshold
If sales rejects more than 30% of routed leads, raise the threshold and inspect the rejection reasons. The rule is useful only when both teams define a qualified lead in the same way. Also test whether a higher cutoff improves seller focus without hiding valuable accounts or slowing response to emerging opportunities.
Use this integration checklist:
- Real-time feature refresh: keep engagement recency and frequency current.
- Capacity-aware routing: match lead flow to available rep coverage.
- Score transparency: show the signals that raised or lowered the score.
- Auditability: record the input data, score version, and retraining date.
For a broader operating view, the AI for B2B lead scoring roadmap places scoring within qualification, routing, and follow-up. That framing matters because a ranking model creates revenue value only when it changes who acts, how quickly they act, and which opportunities receive attention.
Measuring Real Business Impact and ROI
ROI should be measured at the handoff point, not just in the model report. One cited comparison reports that medium-sized companies implementing AI-supported lead scoring saw an average 38% increase in conversion from lead to opportunity, while other figures describe a 20% to 30% rise in conversion for AI-assisted targeting and a separate analysis of 150 companies in which conversion reached 31% after predictive scoring, compared with 20% before (Apollo insights). Those figures aren't interchangeable, because they use different populations and funnel definitions.
What to measure instead
The safest measurement frame is to pick one baseline and one downstream outcome, then hold the comparison steady. Good teams track:
- Lead-to-opportunity conversion
- Opportunity-to-customer conversion
- Sales cycle length
- Revenue per rep
If possible, set up a randomized holdout where one segment receives rule-based scoring and another receives AI scoring. That gives you a cleaner read on whether the system changes decisions, rather than just producing a better-looking score distribution.
Baseline first, model second. If the handoff metric isn't defined clearly, the ROI conversation will drift.
How to avoid false confidence
Seasonality and marketing-mix changes can distort results fast. A campaign shift can make the model look stronger or weaker than it really is, so performance needs to be checked over time rather than declared once. The actual goal is not higher accuracy, it's better sales productivity and more revenue from the same lead flow.
For broader context on proving value, AI business impact measurement is a helpful adjacent resource because it keeps the focus on operational outcomes, not model theater.
Learning from Real Implementations
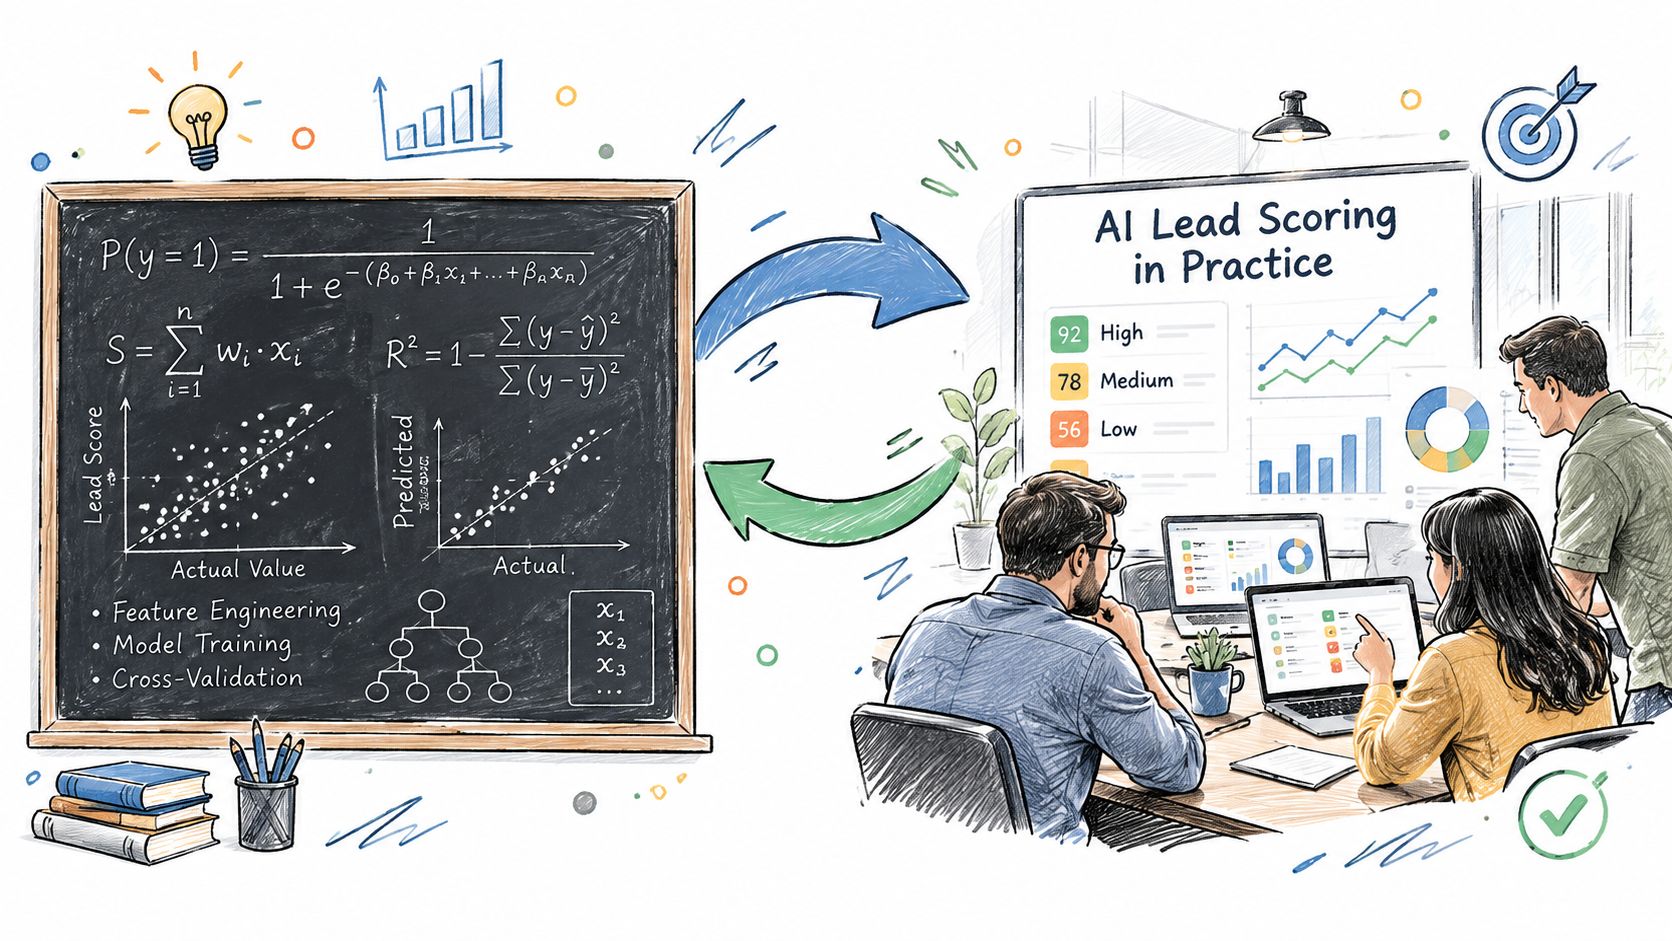
Real implementations show whether AI lead scoring changes revenue operations or merely produces attractive rankings. Applied's library covers real implementations across finance, retail, healthcare, technology, manufacturing, and media, along with AI tools and reports on where organizations apply them. For operations leaders, this context is more useful than a vendor promise because it connects the system to a situation, workflow, and measurable result.
Start with examples that resemble your sales motion. Examine the data entering the model, the action triggered by each score, and the point at which sales accepts or rejects a lead. A scoring project commonly breaks down through inconsistent CRM fields, vague routing rules, or thresholds that account executives do not trust. A model can rank leads accurately while sending the wrong volume to sales or creating follow-up work with little economic return.
What to look for in a real example
Review each implementation against four operating details:
- The source system: where lead and account data originated.
- The handoff rule: which score, event, or combination triggered sales follow-up.
- The governance model: who maintained field definitions, thresholds, and exceptions.
- The outcome metric: what changed after rollout, such as qualified pipeline, rep capacity, or conversion quality.
That's where you learn whether a vendor or internal build fits a real revenue process, and the Applied library is built for exactly that kind of review.
Use the examples to test economic impact, not just model performance. Compare the score-driven process with the prior workflow, inspect how thresholds affect sales capacity, and check whether improved prioritization reaches closed revenue. Visit Applied to review implementations and see how teams structure qualification systems that sales teams can use.