AI in IT Operations: A Practical Enterprise Guide
Explore AI in IT operations with verified case studies, implementation patterns, KPIs, and a roadmap that helps enterprise teams deploy AIOps safely.
October 18, 2026
When the top AI adopters improve incident resolution far more than average adopters using similar features, the interesting question isn't which model they bought. It's what else they changed. That's the pattern running through the strongest evidence on AI in IT operations. The gains are real in several documented deployments, but they're uneven, and they're tangled up with process redesign, telemetry quality, and ticket mix. Treat this as a measurement problem first and a tooling problem second, and you'll make better decisions than teams that start by shopping for agents.
Table of Contents
- Why AI in IT Operations Has Become a Financial Decision
- What AIOps Actually Does in an Operations Stack
- Where Teams Are Adopting AI and Where They Stall
- Four Outcome Categories That Actually Move the Needle
- Separating Real AI Impact from Confounding Factors
- An Implementation Roadmap That Respects Production Reality
- Verified Case Studies from Operations and Security
- Practical Next Steps and What to Explore Further
Why AI in IT Operations Has Become a Financial Decision
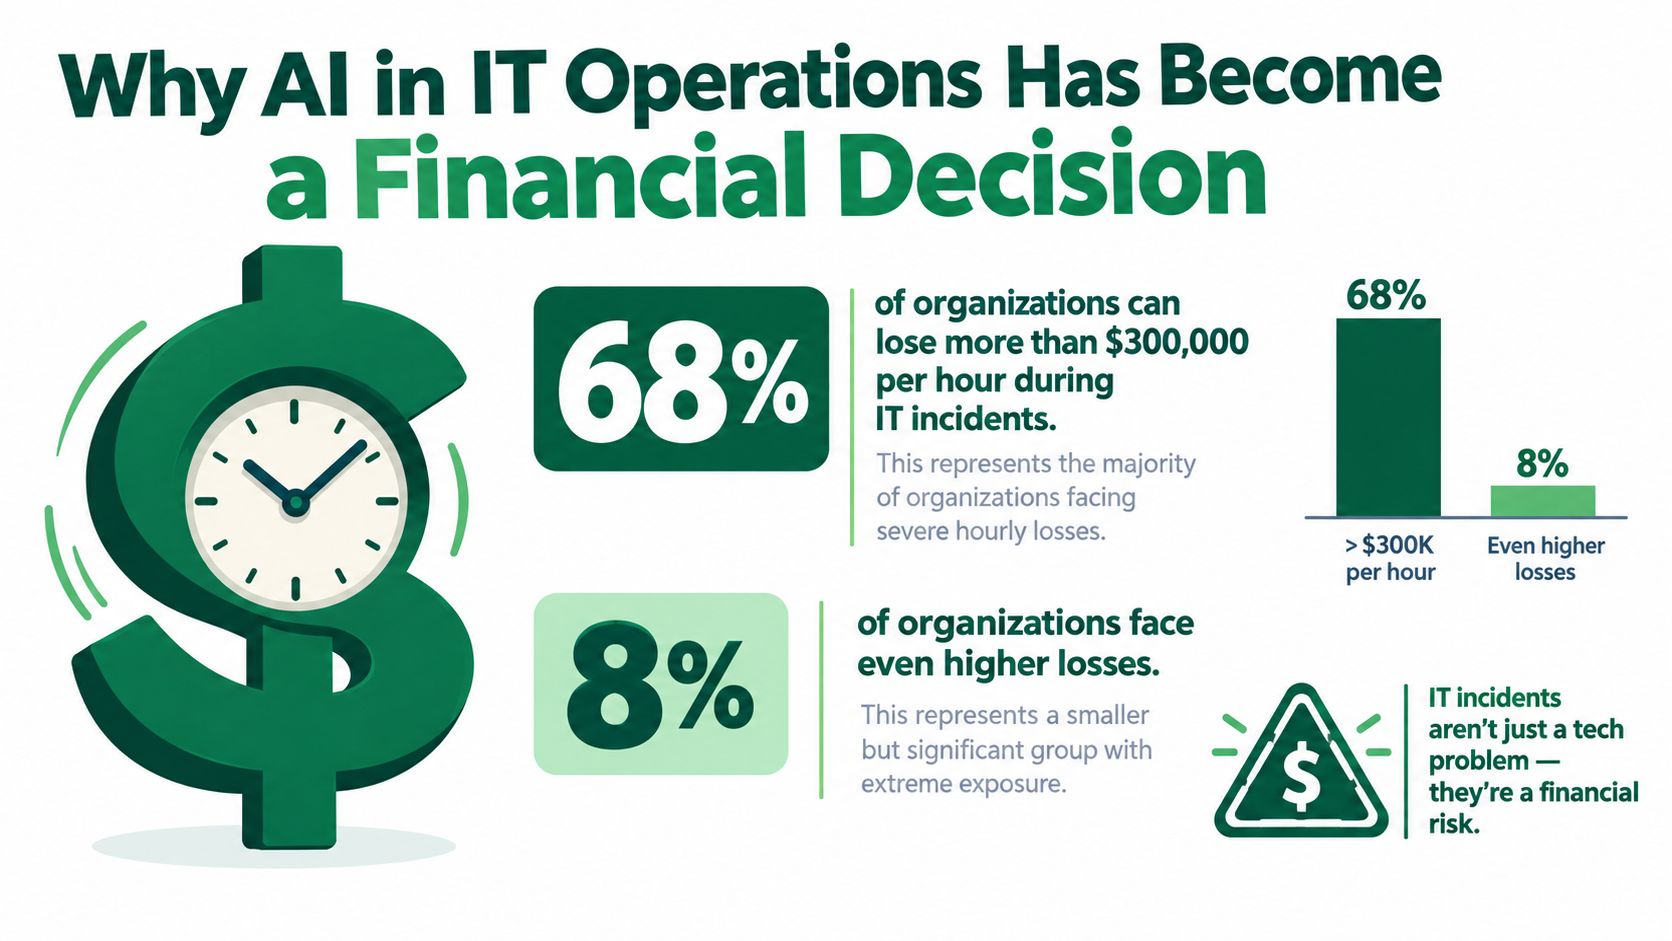
Start with the cost of doing nothing. The 2026 Wakefield Research survey for PagerDuty of 1,000 business and IT leaders found that 68% of organizations could lose more than $300,000 per hour during IT incidents, 34% reported potential losses of at least $500,000 per hour, and 8% faced losses exceeding $1 million per hour. At that exposure level, shaving detection time isn't an engineering nicety. It's a financial control.
The same survey found 59% of respondents actively incorporating AI into digital operations, and 75% of AI adopters reported improved operational resilience, compared with 66% of organizations that had improved resilience but weren't yet using AI. That gap is suggestive, not proof. Organizations with money and mature processes adopt AI earlier, so causality could run either way. But the direction of executive attention is clear. AI in IT operations is being funded as a way to close the detection-to-recovery gap, not as a productivity experiment for the service desk.
What the Money Actually Buys
Framing matters because it changes what you measure. If AI is a productivity tool, you count tickets handled per analyst. If it's financial risk reduction, you count minutes of degraded service avoided, incidents caught before customers notice, and recovery time on the incidents that carry real revenue exposure. Those are different deployments with different guardrails.
- Board-level metric: Incident speed now sits alongside uptime in executive reporting because the hourly cost is legible to finance.
- Adoption signal: Broad active use means vendors and peers are setting expectations your team will be measured against.
- Evaluation signal: You can compare signals, KPIs, and outcome data across industries inside the library of AI use cases, tools, and measured outcomes once you have an account.
The conclusion isn't that every team should automate aggressively. It's that the cost of slow, manual correlation during a major incident is now quantified well enough that doing nothing needs its own justification.
What AIOps Actually Does in an Operations Stack
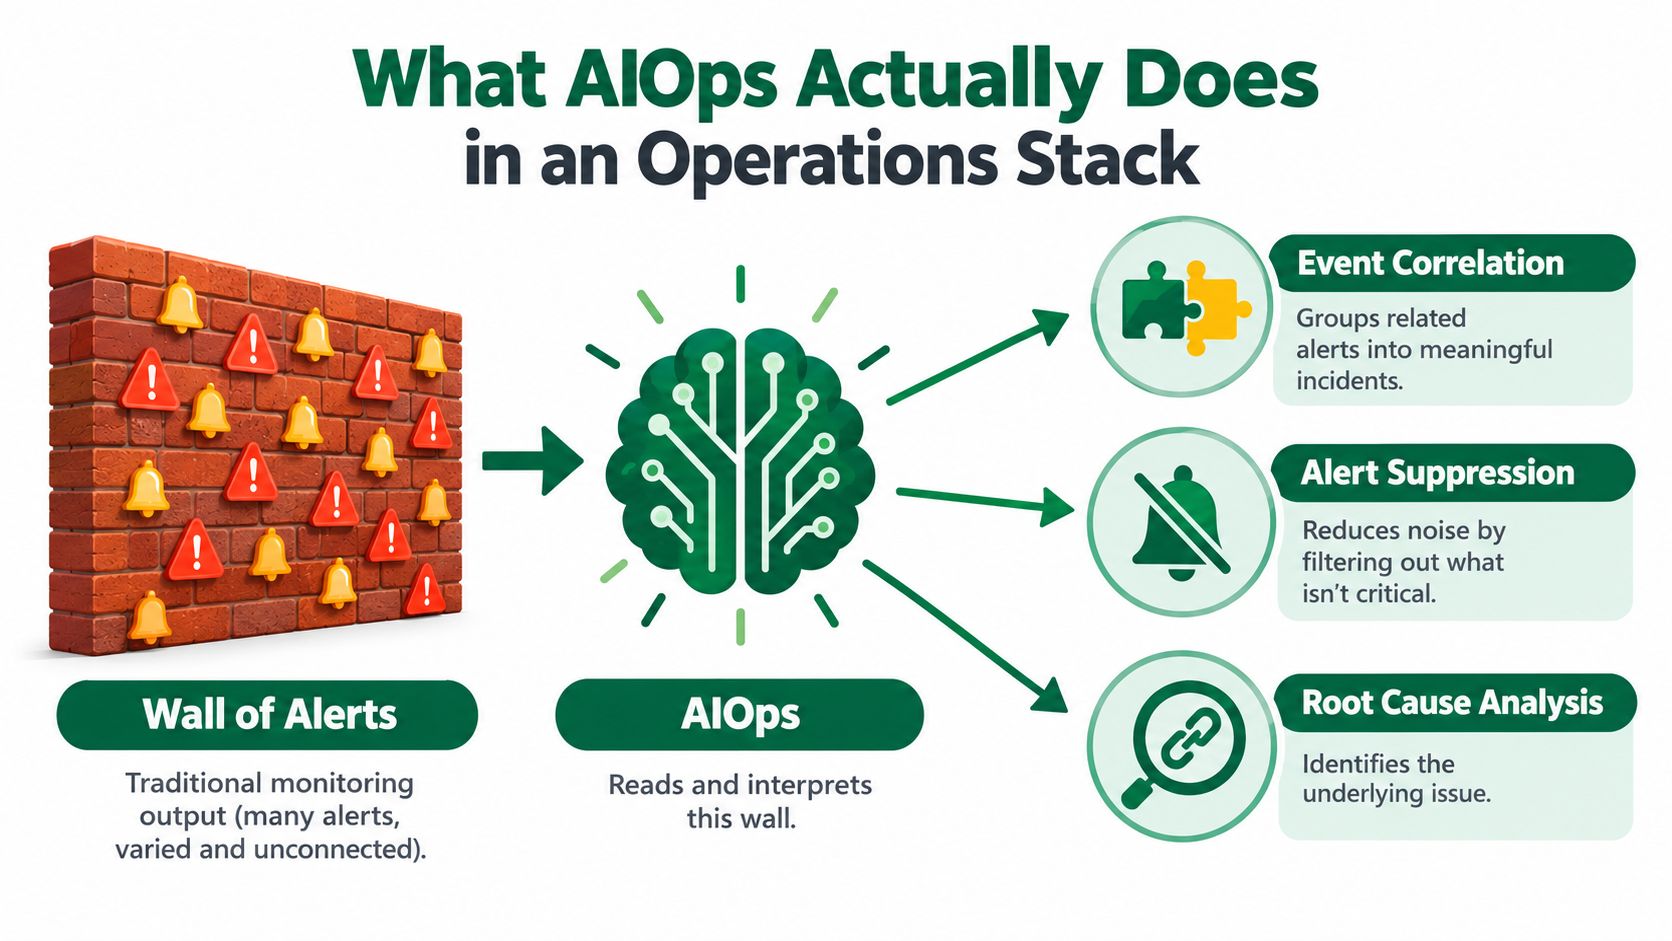
Think of traditional monitoring as a wall of alerts. Every service, host, and dependency posts its own warnings, and an on-call engineer stands in front of the wall during an outage trying to figure out which alerts are causes, which are symptoms, and which are noise. AIOps is the layer that reads the wall for them. It correlates events across systems, suppresses duplicates, and proposes what to look at first.
Four capabilities make up that layer. Anomaly detection flags behavior that deviates from learned baselines before a static threshold trips. Event correlation and noise reduction groups related alerts into a single incident so one failure doesn't page five teams. Automated diagnosis assembles evidence and offers root-cause hints drawn from telemetry, recent changes, and past incidents. Remediation ranges from a suggested action an engineer approves to a change the system executes on its own.
A Memory Leak, Start to Finish
Take a slow memory leak in one service. Without AIOps, you get a cascade. Memory warnings on the host, latency alerts on dependent services, error-rate pages from the API tier, and a queue-depth alarm somewhere downstream. Four teams open four investigations. With the capabilities chained together, anomaly detection spots the abnormal memory growth pattern early, correlation folds the downstream alerts into one incident, diagnosis points at the leaking deployment and the recent change that introduced it, and remediation can be as modest as recommending a rollback or as assertive as restarting the affected workload within preset limits.
A useful test for any AIOps pitch is whether the vendor can walk your worst recent incident through their correlation logic using your actual alert history.
This is also where AIOps differs from pointing a raw large language model at your logs. The value comes from integration with telemetry pipelines, ticketing systems, and change records. A model that can't see what changed an hour ago, or can't open and update the incident record, is a summarizer, not an operations layer. The same integration logic applies at the service desk tier, where teams looking to streamline service desk with AI connect ticket intake, knowledge, and routing so the model works inside the workflow rather than beside it.
Map each capability to a specific pain before you buy anything. Alert fatigue points to correlation. Slow detection points to anomaly detection. Long investigations point to diagnosis support. Buying all four at once, for every service, is how pilots stall.
Where Teams Are Adopting AI and Where They Stall
Exploration is broad. Atlassian's 2025 State of Incident Management survey of more than 500 software developers, IT professionals, and IT decision-makers in the United States found that 79% of teams were exploring AI for incident trending, using it to analyze recurring failures, alerts, and operational patterns. That's a sensible entry point. Trending is read-only, it works on historical data, and a wrong insight costs a wasted meeting rather than a production change.
The same survey found 74% of respondents identified security risks as a leading barrier to expanding AI use. Put those two numbers together and you get the actual state of the field. Teams are comfortable letting AI read operational data. They're much less comfortable letting it access sensitive systems broadly, retain that data, or act on what it finds. The bottleneck isn't model capability. It's trust, access governance, and validation of whatever the system recommends.
The Deployment Gap
Exploration numbers flatter the industry. A 2025 Riverbed AIOps survey reported that only 12% of AI initiatives had reached full deployment while 62% remained in pilot or development stages, and it found persistent data problems across at least half of organizations. Scaling, not experimentation, is where programs die.
Role matters here. That research also found technical specialists were less optimistic than business leaders about AI. This shouldn't surprise anyone. Decision-makers see the demo and the business case. Operators see the incomplete telemetry, the undocumented dependencies, and the alert rules nobody has cleaned up in years. Developers sit between the two, often enthusiastic about assistance with investigation and skeptical about autonomous changes to systems they own.
- Decision-makers push for speed and cost outcomes and tend to underestimate data cleanup.
- Operators carry the pager, so they price in false positives and bad automated actions.
- Developers adopt fastest where AI shortens investigation without touching production state.
If your program plan doesn't name who fixes the underlying data quality problems, and who has authority to expand AI access beyond read-only, you've planned a pilot, not a deployment.
Four Outcome Categories That Actually Move the Needle
Most AIOps business cases fail because they track everything and therefore prove nothing. Four outcome categories cover nearly every credible claim, and each maps to different capabilities. Pick the category where your current pain is worst, instrument it properly, and let the others wait.
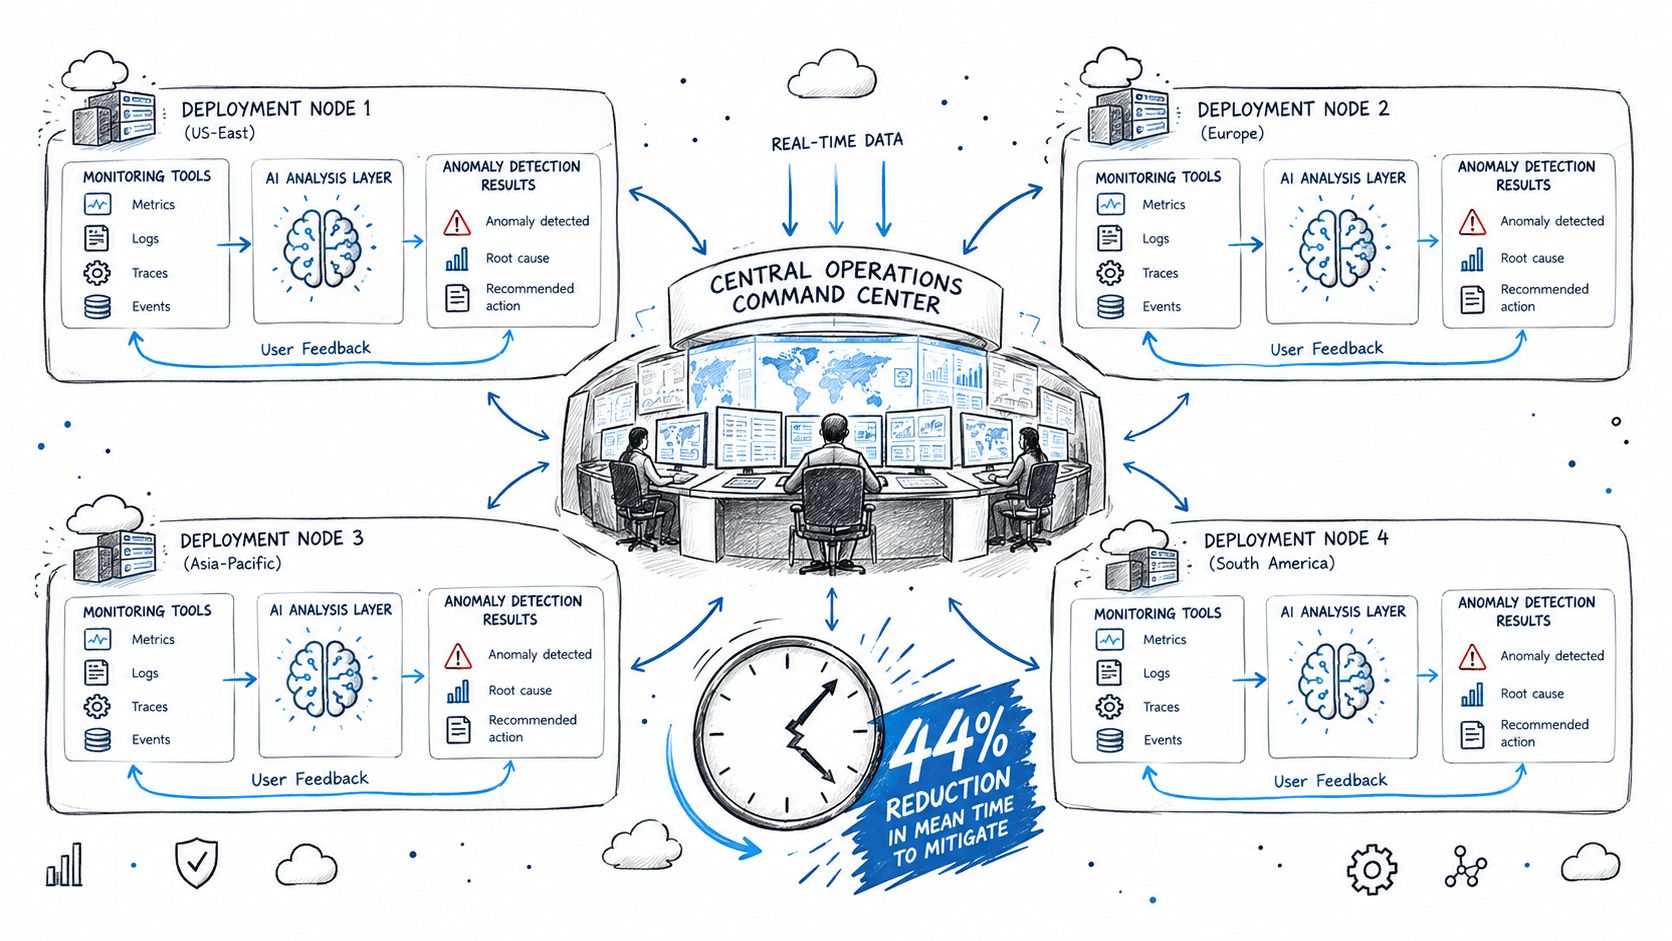
Detection is about finding real problems earlier and ignoring non-problems. Google SRE's ML-based anomaly-detection workflow increased the number of useful operational findings by 195%, which is the right kind of metric for this category because it measures signal quality, not alert volume. Response covers how fast you move once something is detected. That same Google workflow reduced mean time to mitigate supported incidents by approximately 44%, and a separate capability analyzing user feedback for outage detection produced a 10% reduction in mean time to mitigate. Note the word supported. The gain applies to incident types the workflow was built for, which is exactly how you should scope your own claims.
AI Outcomes Mapped to Capabilities and Metrics
| Outcome category | Driving capability | Metric to track |
|---|---|---|
| Detection | Anomaly detection, event correlation | Useful findings rate, alerts per incident, mean time to detect |
| Response | Automated diagnosis, evidence assembly | Mean time to mitigate, mean time to resolve by severity |
| Cost | Ticket summarization, routing, knowledge recommendations | Hours saved per incident, cost per resolved incident |
| Resilience | Trending, predictive signals, guarded remediation | Incidents absorbed without customer impact, repeat incident rate |
Cost and Resilience Need Different Evidence
Cost is where service-desk style AI earns its keep, through hours saved on summarization, drafting, and routing. Resilience is the hardest category to prove because success looks like nothing happening. You measure it indirectly, through repeat incidents that stop recurring after trending analysis exposes the pattern, and through incidents absorbed without customer-visible degradation.
Practical rule: If a vendor quotes you a response improvement but can't tell you the detection baseline it was measured against, you're looking at marketing arithmetic.
The disciplined move is to measure mean time to detect and mean time to mitigate separately, establish a pre-AI baseline for both, and deploy first where telemetry quality is high and investigative patterns repeat. That's where the documented gains came from.
Separating Real AI Impact from Confounding Factors
Lower MTTR is not proof that AI works. It's proof that incidents got resolved faster during a period when AI was present, which is a different and weaker claim. Staffing changed. Runbooks improved. Ticket mix shifted. Maybe the AI got handed the easy incidents first, which is rational deployment and terrible experimental design.
The best available dataset shows why this distinction matters. SolarWinds' 2025 State of ITSM analysis of more than 2,000 systems and over 60,000 anonymized data points found GenAI adopters reduced average resolution time from 27.42 hours to 22.55 hours, a 17.8% saving of 4.87 hours per incident, while non-adopters averaged 32.46 hours. Adopters collectively saved 323,343 hours during the study period. But the top AI adopters showed a 54.3% improvement, and the largest gains came when AI adoption was combined with process refinement and change management.
Read that carefully. If the tool alone explained the results, adopters would cluster together. Instead the spread between average and top adopters is enormous, which points at implementation maturity as the dominant variable. The organizations that redesigned workflows, cleaned up knowledge, and managed the change with their teams got three times the benefit of the average adopter using comparable features.
A Baseline Framework That Survives Reality
- Counterfactual: Compare matched incident types and severities before and after, or against a team that hasn't adopted yet. Never compare this quarter's easy tickets to last quarter's outages.
- Cost per resolved incident: Include human-review time spent checking AI output. Review isn't free, and hiding it inflates the saving.
- False escalations and reopened incidents: Faster closure that bounces back isn't resolution. Track both from day one.
- Persistence: Re-measure after the initial deployment period, when novelty and extra attention have faded.
This is the same discipline covered in the broader framework for measuring AI business impact, applied to operations data. Build the baseline before you switch anything on. Retrofitting one afterward means arguing from memory, and memory always flatters the project sponsor.
An Implementation Roadmap That Respects Production Reality
Sequence is the whole game. Teams that start with autonomous remediation and work backward to data quality end up rolling back under pressure. Teams that earn trust in stages get to expand. This sequence follows the evidence on where gains appeared first, and it aligns with the phased thinking in the AI implementation roadmap for enterprise teams.
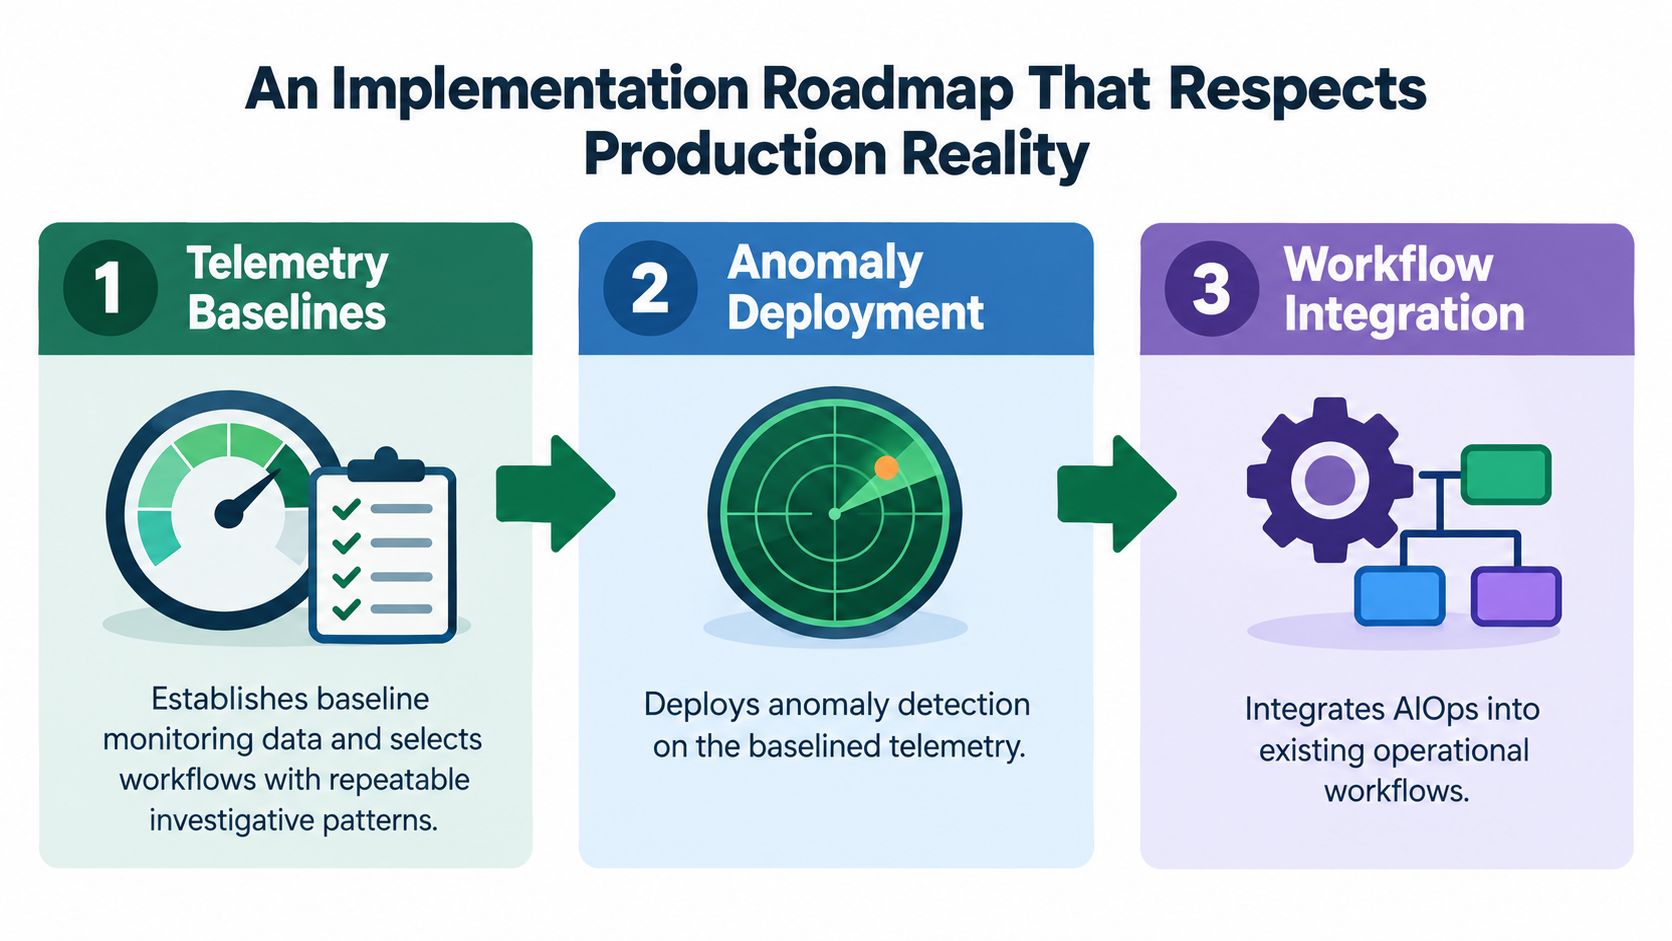
Phase 1, baselines and workflow selection. Audit telemetry quality per service. You're looking for workflows with repeatable investigative patterns, where engineers run the same checks in the same order most of the time. Record current detection and mitigation times for those workflows specifically. This phase is unglamorous and it's where most of the eventual ROI is decided.
Phase 2, detection and correlation in production. Deploy anomaly detection and event correlation on the baselined workflows. Set explicit confidence thresholds, keep audit logs of what the system surfaced and suppressed, and measure against your Phase 1 numbers. The system advises and organizes. Humans still decide.
Phase 3, approval-gated remediation. Introduce actions the system can execute after a human approves, starting with reversible moves. Restarting an unhealthy stateless workload. Clearing a known transient failure. Scaling within predefined limits. Each action gets least-privilege credentials, a defined rollback, and a named owner who can revoke it.
Phase 4, bounded autonomy. Only after approval-gated actions have a clean track record do you remove the human from specific, low-blast-radius loops. Ambiguous or high-impact incidents stay routed to operators regardless of how well the pilot went.
The short walkthrough below shows how these phases look when a team connects detection to workflow tools in practice.
Keep one distinction sharp throughout. Service-desk assistance, such as drafting a ticket response, carries almost no production risk and can move fast. Production remediation changes live system state and should move at the speed of your evidence. For broader context on sequencing AI across functions without breaking operations, the MR2 Solutions AI transformation insights cover similar phased logic at the enterprise level. Once your phases are defined, an account on the platform gives you a starting point for planning tools and KPI rollups against comparable deployments.
Verified Case Studies from Operations and Security
Four documented deployments show what the architectures did, and they also show why you shouldn't average their numbers together. A research prototype, a mature SRE program, and a security orchestration deployment are measuring different things under different constraints.
Google SRE and the Research Prototype
Google SRE's anomaly-detection workflow, covered in the outcomes section above, worked through a specific mechanism. Instead of on-call engineers manually collecting and correlating signals across monitoring systems, the workflow surfaced anomalous behavior and organized the evidence into investigation dashboards before human diagnosis began. The gain came from automating evidence assembly, not from automating the decision. That's a pattern any enterprise can copy without Google's scale.
The arXiv LLM agent prototype for cloud fault detection and mitigation sits at the other end of the maturity spectrum. It recorded problem detection in 14 seconds and mitigation in 36 seconds, demonstrating a clean control loop where telemetry is observed, the model interprets the incident, and an action is selected. Those timings show what's possible for the detection-to-action interval. They are not a production MTTR benchmark, because a proof-of-concept environment doesn't include your change windows, your approval chains, or your messy dependencies. The design lesson is the constraint set, explicit tools, least-privilege credentials, and reversible actions.
Security Operations at Production Scale
IBM's reporting on AI for cybersecurity describes organizations that monitored 95% of network communications and reduced median time to detect incidents by 12% and median time to respond and recover by 11% against pre-implementation estimates. The top 25% of adopters did considerably better, cutting investigation time by nearly one-third, response and recovery time by nearly one-quarter, and attacker dwell time by 45%. In one implementation, automated triage rose from 40% to 73% of alerts at greater than 90% confidence while reported security incidents fell by 75%.
A published study of AI-enhanced SOAR at a major financial institution shows the more assertive pattern. AI-powered playbooks combined threat-intelligence and endpoint-detection inputs and triggered context-aware containment under configured decision rules, producing a 60% reduction in mean time to respond. The system executed, but only inside predefined playbooks. That's the realistic shape of production autonomy today. For a comparable operations-side pattern, see the Ensono use case on predicting IT failures and cutting MTTR.
Practical Next Steps and What to Explore Further
You can start this week without buying anything. The first moves are measurement and governance decisions, and they're the ones that determine whether a later tool purchase produces evidence or anecdotes.
- Pick two outcome categories. Detection and response suit most infrastructure teams. Cost suits service-desk-heavy organizations. Choose one primary metric per category and write down exactly how it's calculated.
- Audit telemetry quality. Score your candidate workflows on signal completeness and repeatability of investigation. Start where both are strong, even if that isn't your most painful service.
- Establish pre-AI baselines. Use a defined historical window, segmented by severity and incident type. Include reopened incidents and false escalations so speed can't be bought with sloppiness.
- Define override and rollback before autonomy. Name who can countermand an AI-generated remediation, how a wrong diagnosis gets logged, and what the rollback path is for every automated action.
The Governance Questions Most Teams Skip
More autonomy increases operational risk unless supervision matures first. Before expanding beyond read-only assistance, answer these in writing. Who can override an automated change in progress? How are hallucinated or incorrect diagnoses recorded so the system and the team learn from them? How do you monitor model drift as your infrastructure changes underneath the model? Who audits tool permissions, and how often? What does the system cost to run at full telemetry volume, not pilot volume?
The teams that scale successfully treat the AI system itself as a production service, with an owner, an error budget, and an incident process of its own.
From there, compare your plan against documented deployments rather than vendor claims. Create an account to explore the library of AI use cases, tools organized by industry and business function, and measured outcomes, and filter for operations and service management examples that match your stack and severity profile. Bring your baseline numbers with you. They're what turn someone else's case study into a realistic forecast for your own environment, and they're what will let you prove, a year from now, that the improvement came from the system you built and not from an easier year.
Applied catalogs verified AI implementations with the company, tools, and quantified outcome named for each one, including operations and IT service management deployments you can benchmark your baselines against. Create an account to access the full library of use cases and tools organized by industry, business function, and outcome, then compare your detection and response metrics against teams that have already run these playbooks. Start exploring at Applied.